This page lists the new features or enhancements in FP&A Plus. To stay informed on coming feature changes, see the Product alerts page.
2026
2026.5.7
June 2026
This release contains no enhancements.
2026.5.6
June 2026
This release contains no enhancements.
2026.5.5
May 2026
This release contains no enhancements.
2026.5.3
May 2026
Table Tiles: Display and usability improvements
Table tiles in Dashboard Studio now include several visual and usability updates that improve readability and keep the focus on your data:
-
Auto-Sized Columns and Row Headers — Columns and row headers now automatically resize to make optimal use of the available tile width, eliminating the need for manual adjustments.
-
Updated Header Background — The header background has been updated from bold blue to a neutral surface color — white in Light theme — for a cleaner, more consistent look. Font weight and padding remain unchanged.
-
Updated Grid Label Cell Color — Grid label cells have been updated from bold blue to white, shifting visual focus back to the data where it belongs.
Formula Input: Auto-resizing field
Formula input fields now resize automatically based on the length and complexity of the formula. Short formulas appear in compact fields, while longer, multi-line formulas expand within defined minimum and maximum size limits to improve readability and display more content directly within the page.
When a formula reaches the maximum field height, the input field becomes scrollable so users can continue reviewing the full formula without leaving the page. This makes it easier to read, validate, and audit complex formula logic directly within the field, without needing to copy and paste content into another application.
Previously, input fields used a fixed size that often created usability issues. Fields appeared oversized for simple formulas and too constrained for complex formulas, making it harder to review formula logic efficiently at a glance.
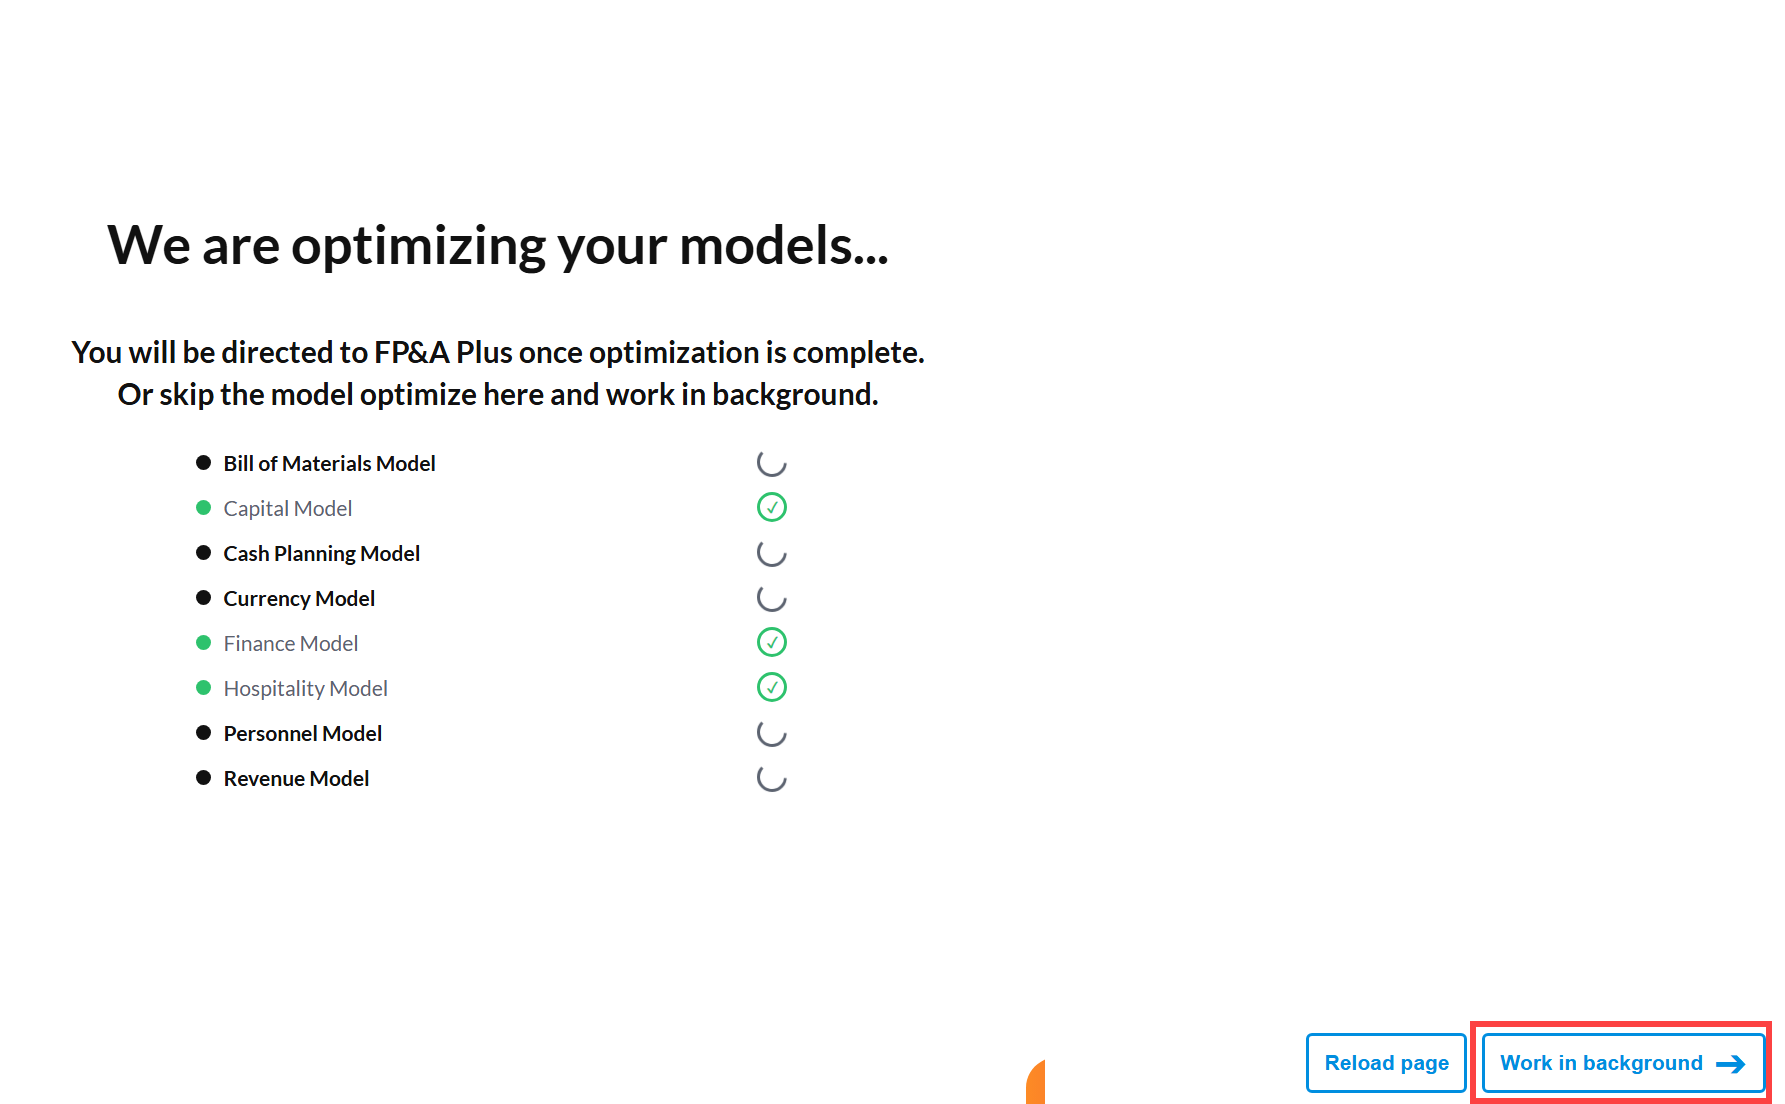
Model Optimization page: New "Work in Background" option
When launching FP&A Plus, you can now bypass the model optimization wait time and start working immediately. On the Model Optimization page, select Work in Background to continue to the application while optimization runs behind the scenes.
If a model fails to optimize, you will receive a notification with guidance based on your role.
2026.4.3
April 2026
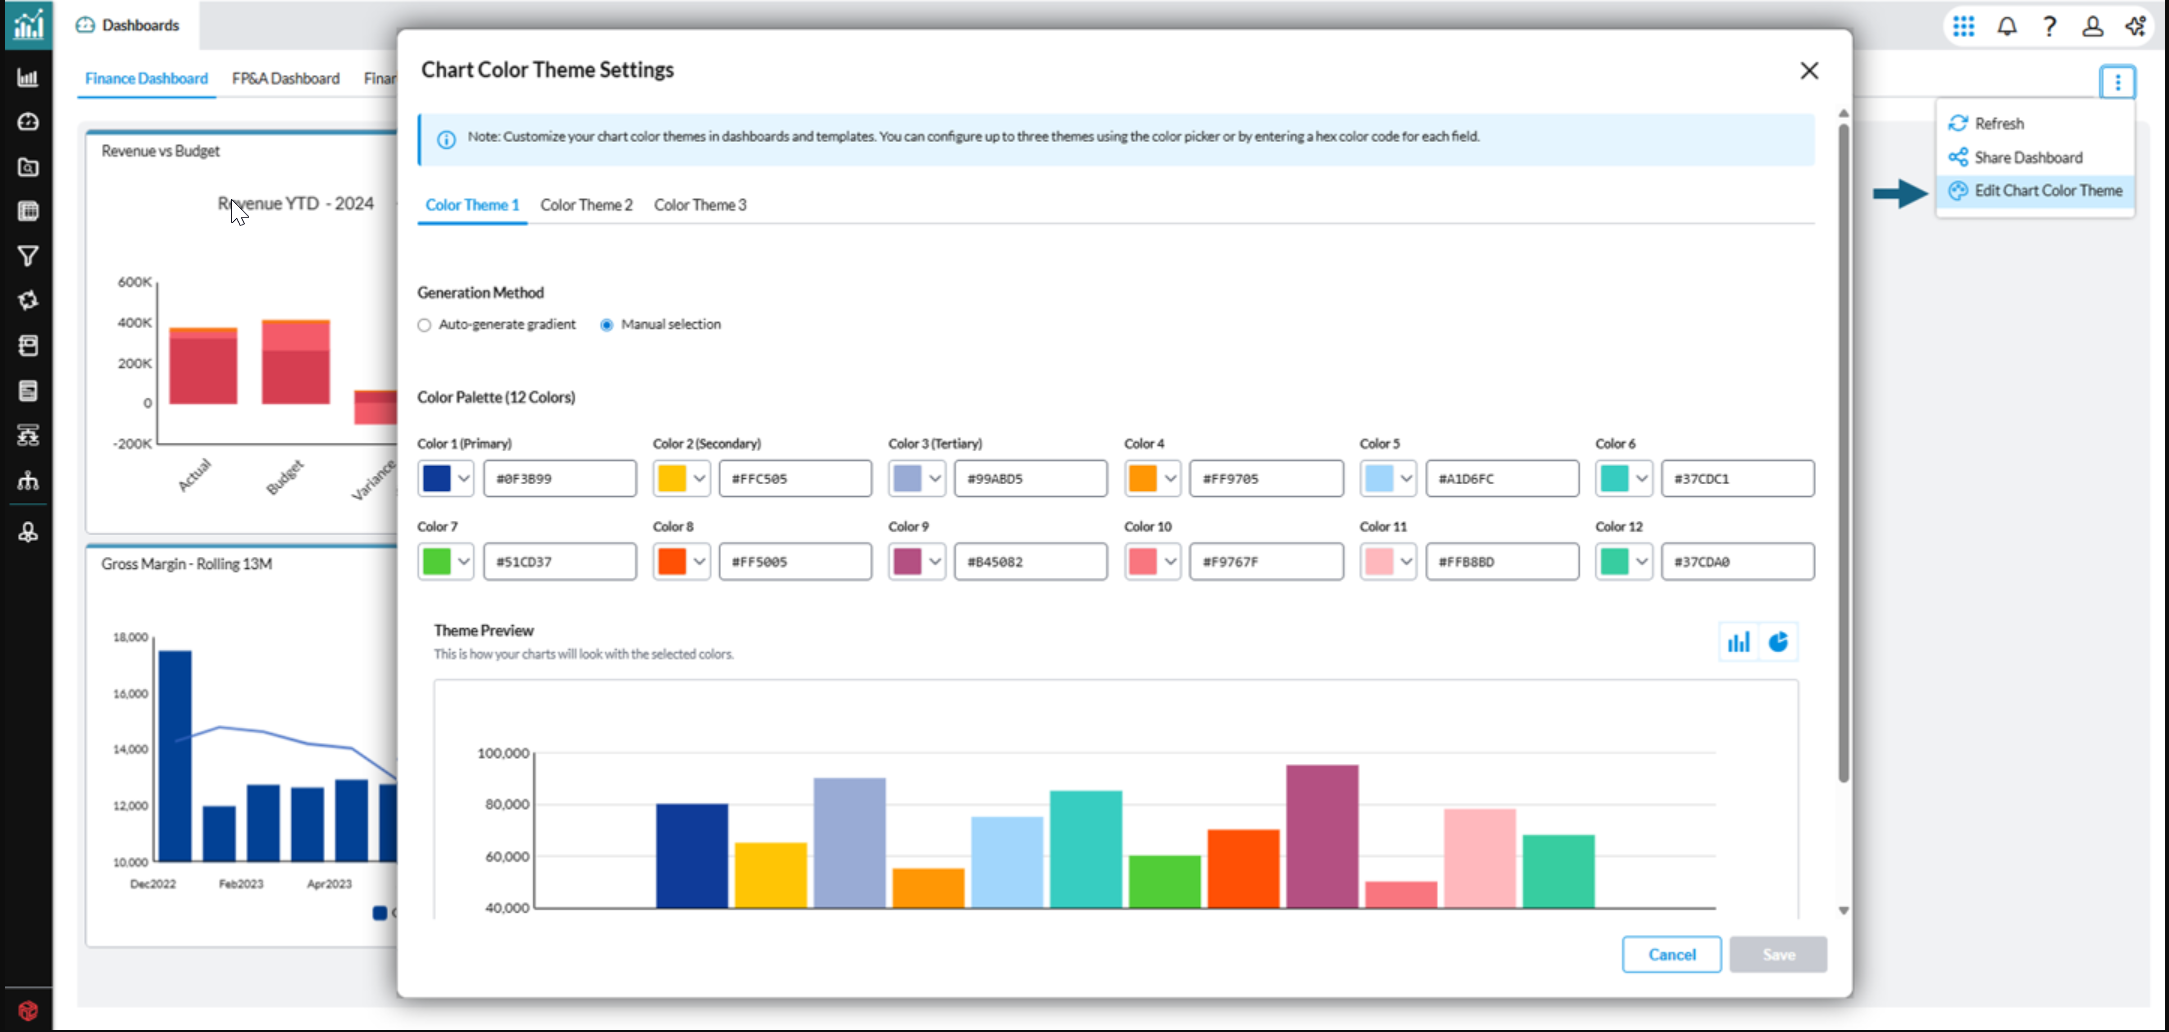
Custom chart color themes
Define, manage, and apply corporate chart color themes consistently across all dashboards and templates — no manual customization required:
-
Open Dashboard Runtime or Dashboard Studio, or navigate to Template Studio.
-
Open Chart Color Theme Settings from the Settings panel.
-
Admins/advanced users: create or edit a corporate theme.
-
Designers: select a theme from the approved list and apply it.
-
Charts auto-reflow when tiles are resized
When you resize a tile, the chart inside automatically adjusts to fit, always staying readable and front and center.
Badge tile content now scales with tile size
Badge tiles now support Auto-fit to tile size as a font sizing mode, proportionally scaling badge tile text whenever the tile is resized.
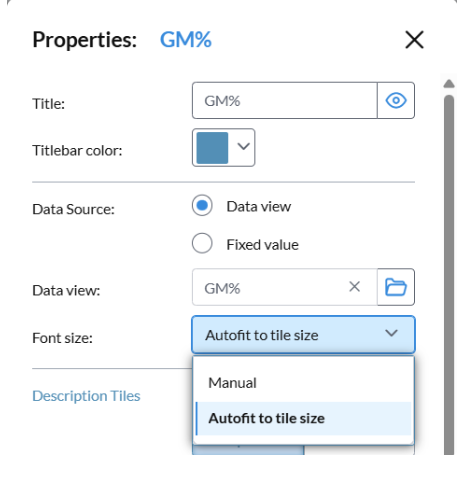
Note: The existing Manual font size option remains available and continues to behave as before.
What scales automatically:
-
Typography — metric values, delta indicators, and labels resize proportionally to tile area.
-
Spacing and dividers — padding and divider spacing adjust per screen size and tile dimensions.
-
Progress bars — height and width ratios scale with the available tile space.
-
Embedded visuals — badge-level charts resize within the tile, independent of full chart tile behavior.
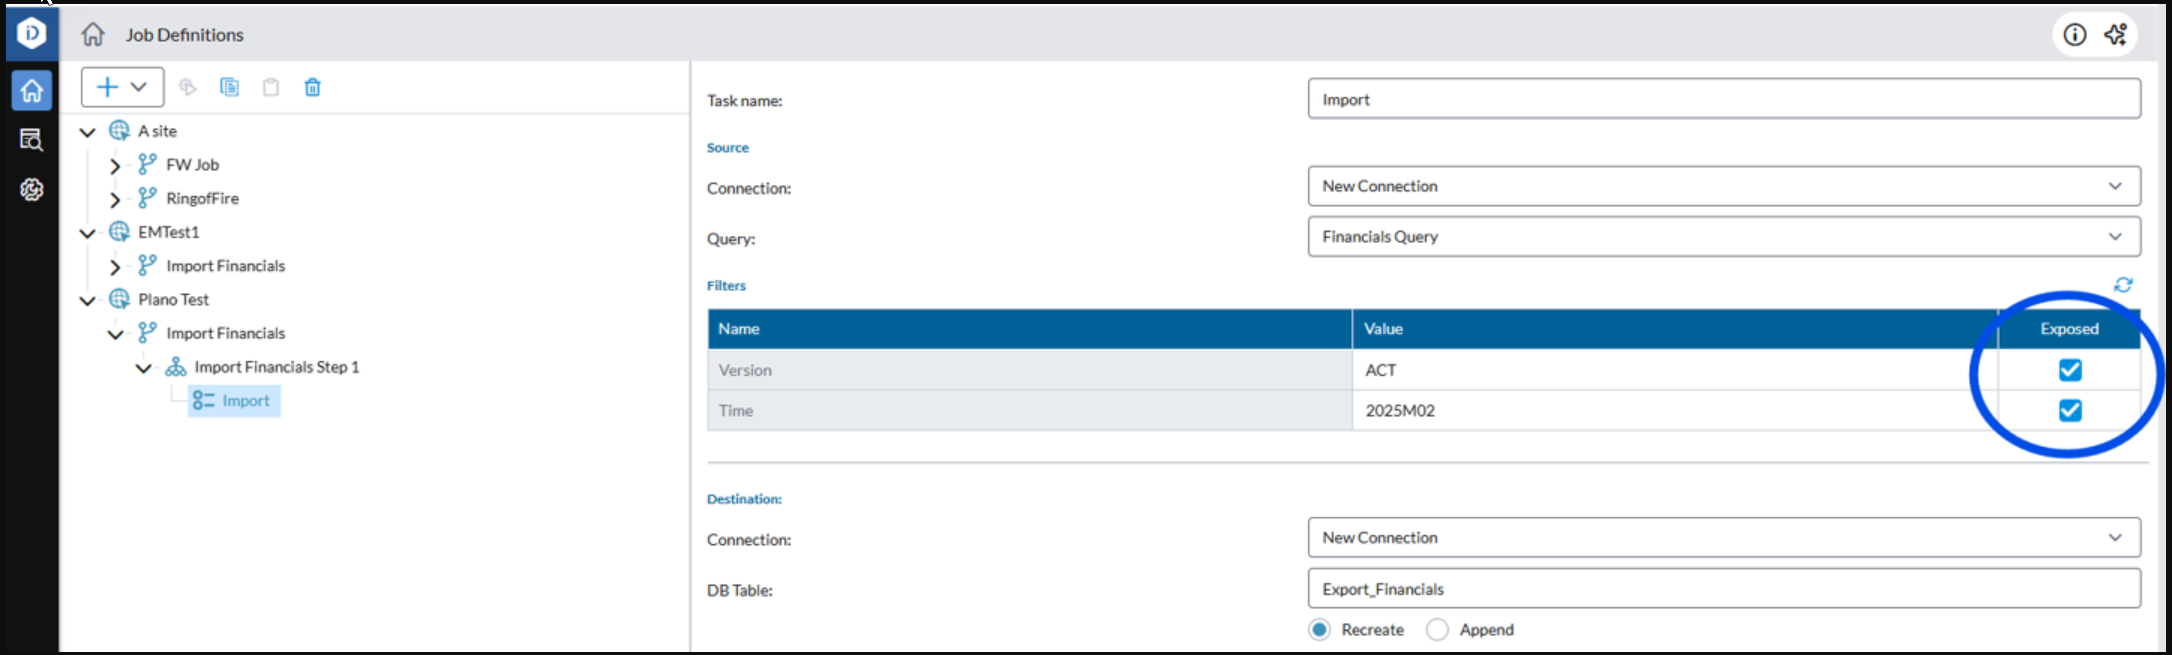
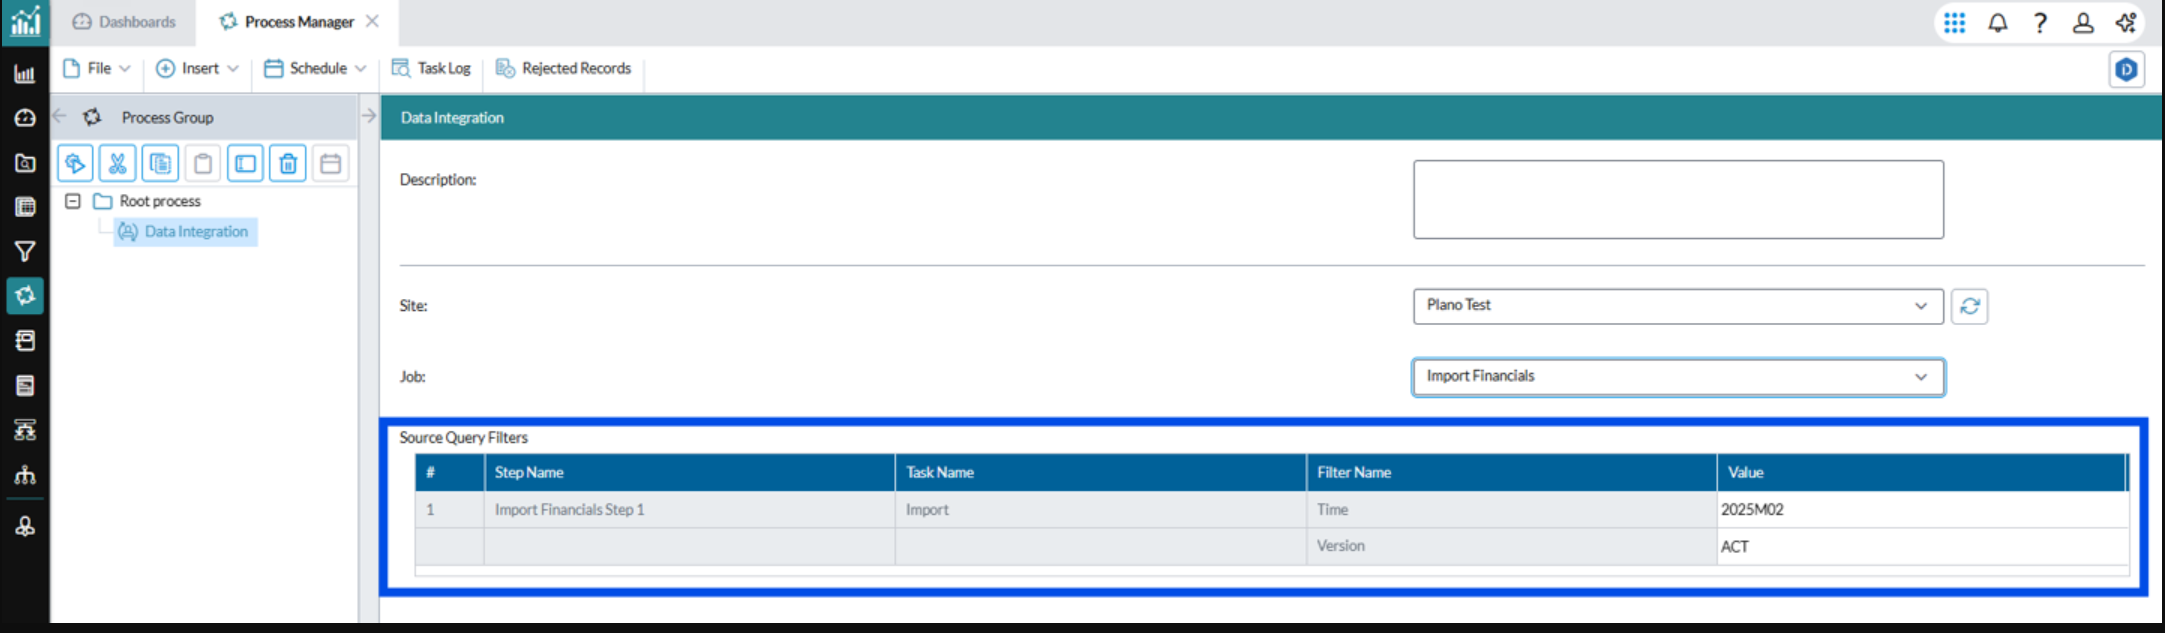
Override DI filter values directly in Process Manager
When a Data Integration (DI) administrator exposes filters on a task in DI, those filters are now available to override in FP&A Plus. There is no need to return to DI to adjust values before running a process.
How it works:
-
In DI — a DI administrator marks one or more task filters as Exposed.
-
In FP&A Plus > Process Manager — select a Site and Job in a Data Integration process step.
-
Process Manager automatically displays any tasks that have exposed filters, showing each filter name and its current default value.
-
Accept the defaults, or type a replacement value to use when the process runs — for example, 2026-03 for a period filter.
2026.3.2
April 2026
Prophix Copilot now available in Microsoft Teams
Prophix Copilot is now available in Microsoft Teams, providing an additional way to interact with Copilot within the tool where users collaborate.
The Teams integration connects to the same Copilot back-end services used by the Prophix Portal. As a result, Copilot capabilities, security, and governance remain consistent across interfaces.
Key capabilities
-
Access in Teams – Interact with Copilot directly within Microsoft Teams using a chat-based experience.
-
Consistent Copilot capabilities – Perform the same Copilot interactions available in the Prophix Portal.
-
Unified governance and security – Requests follow the same authentication, authorization, and data access controls enforced by Prophix permissions.
-
Interface-specific sessions – Teams and the Portal share the same back-end services, but sessions do not carry over between interfaces.
To install the Teams app, see Prophix Copilot in Teams.
2026.2.0
February 2026
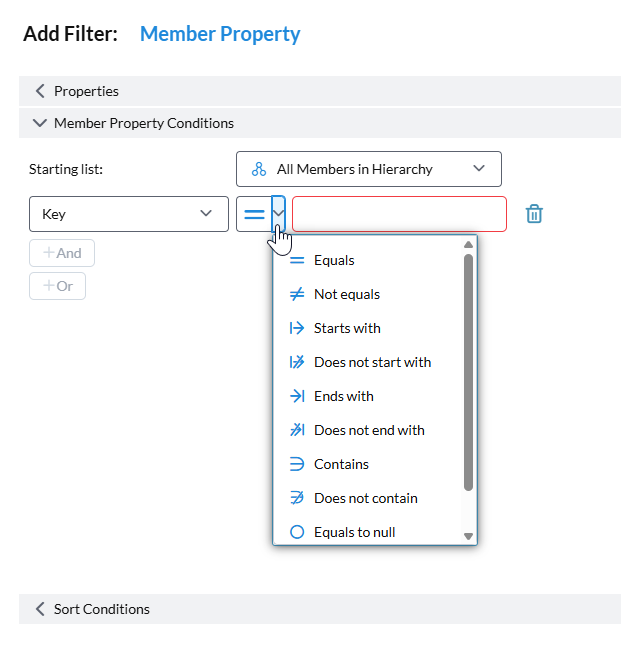
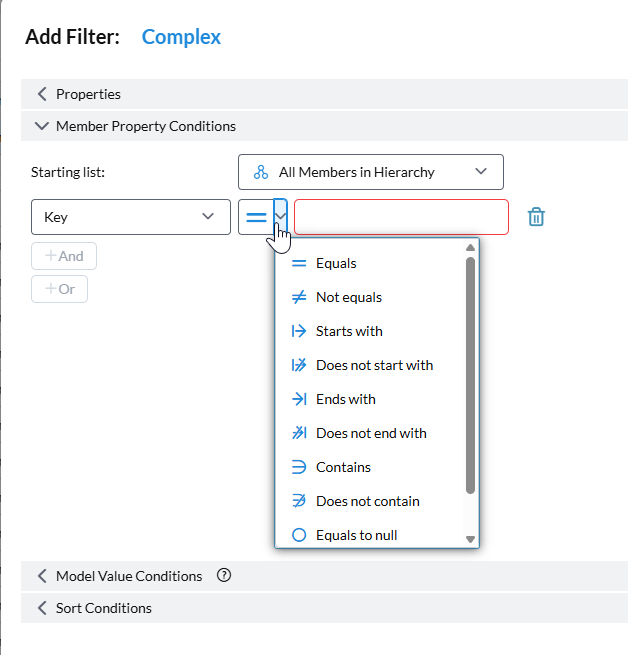
Expanded Conditional Logic for Member Property and Complex Filters
In this release, we introduced new operators to Member Property and Complex filters to give you greater flexibility when defining filter conditions.
The following operators are now available for both Member Property and Complex filters:
|
|
|---|---|
-
Does not start with (Text member properties only)
-
Does not end with (Text member properties only)
-
Does not contain (Text member properties only)
-
Contains (Text and Date member properties only)
-
Equals to null (Text, Number, and Date member properties only)
-
Does not equal to null (Text, Number, and Date member properties only)
2026.1.3
January 2026
This release contains no enhancements.
2026.1.0
January 2026
Universal Navigation
The Universal Navigation menu makes it easier to move between applications, providing a more seamless experience across Prophix applications.
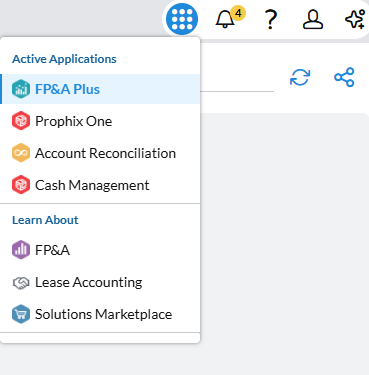
You can now:
-
Navigate to applications you have access to under Active Applications
-
Discover additional Prophix applications under Learn About
-
Access Data Integration under Others, when permission is granted
2025
2025.12.2
December 2025
Formula Bar: Toggle between Keys and Names
In Ad Hoc Analysis you now have greater control over how formulas are displayed. Using the Formula Bar Member Display options, you can switch between business-friendly Names and technical Keys. This flexibility lets you view formulas in the format that best supports your work—whether you’re building models, reviewing assumptions, or troubleshooting issues.
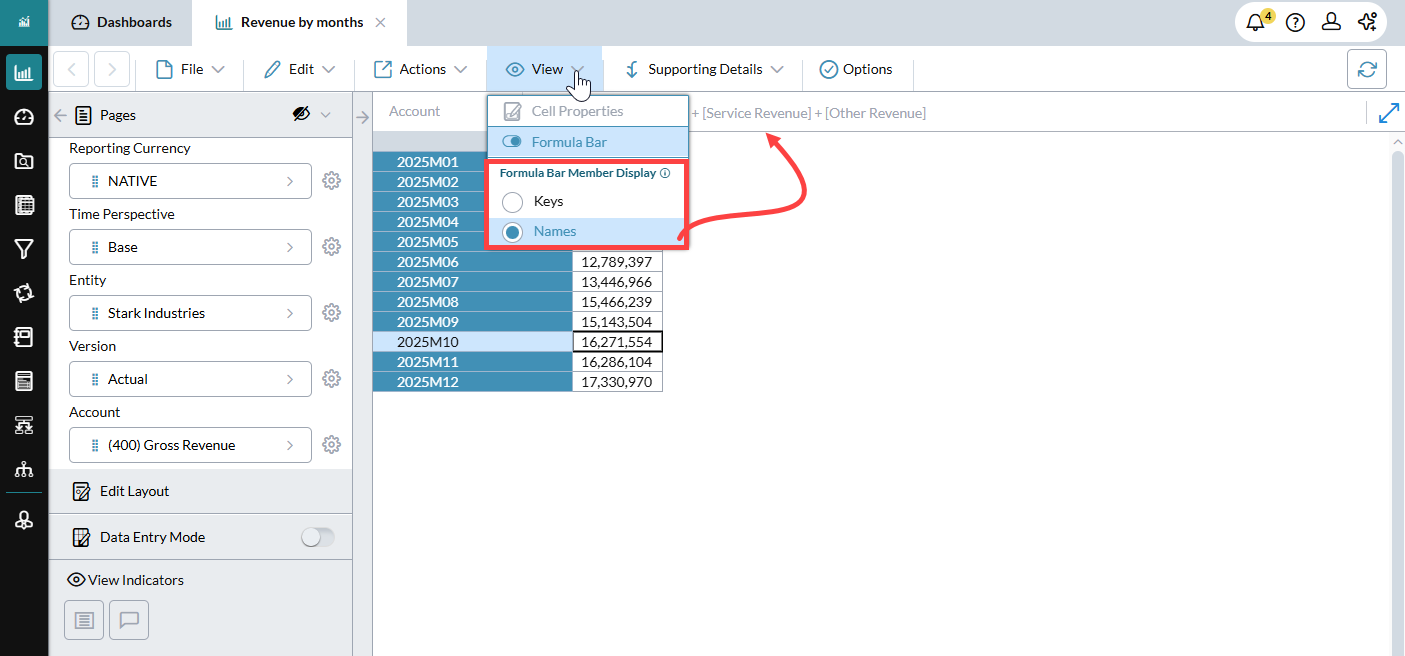
-
With the Formula Bar toggle on, you can choose whether to display Names or Keys in the bar.
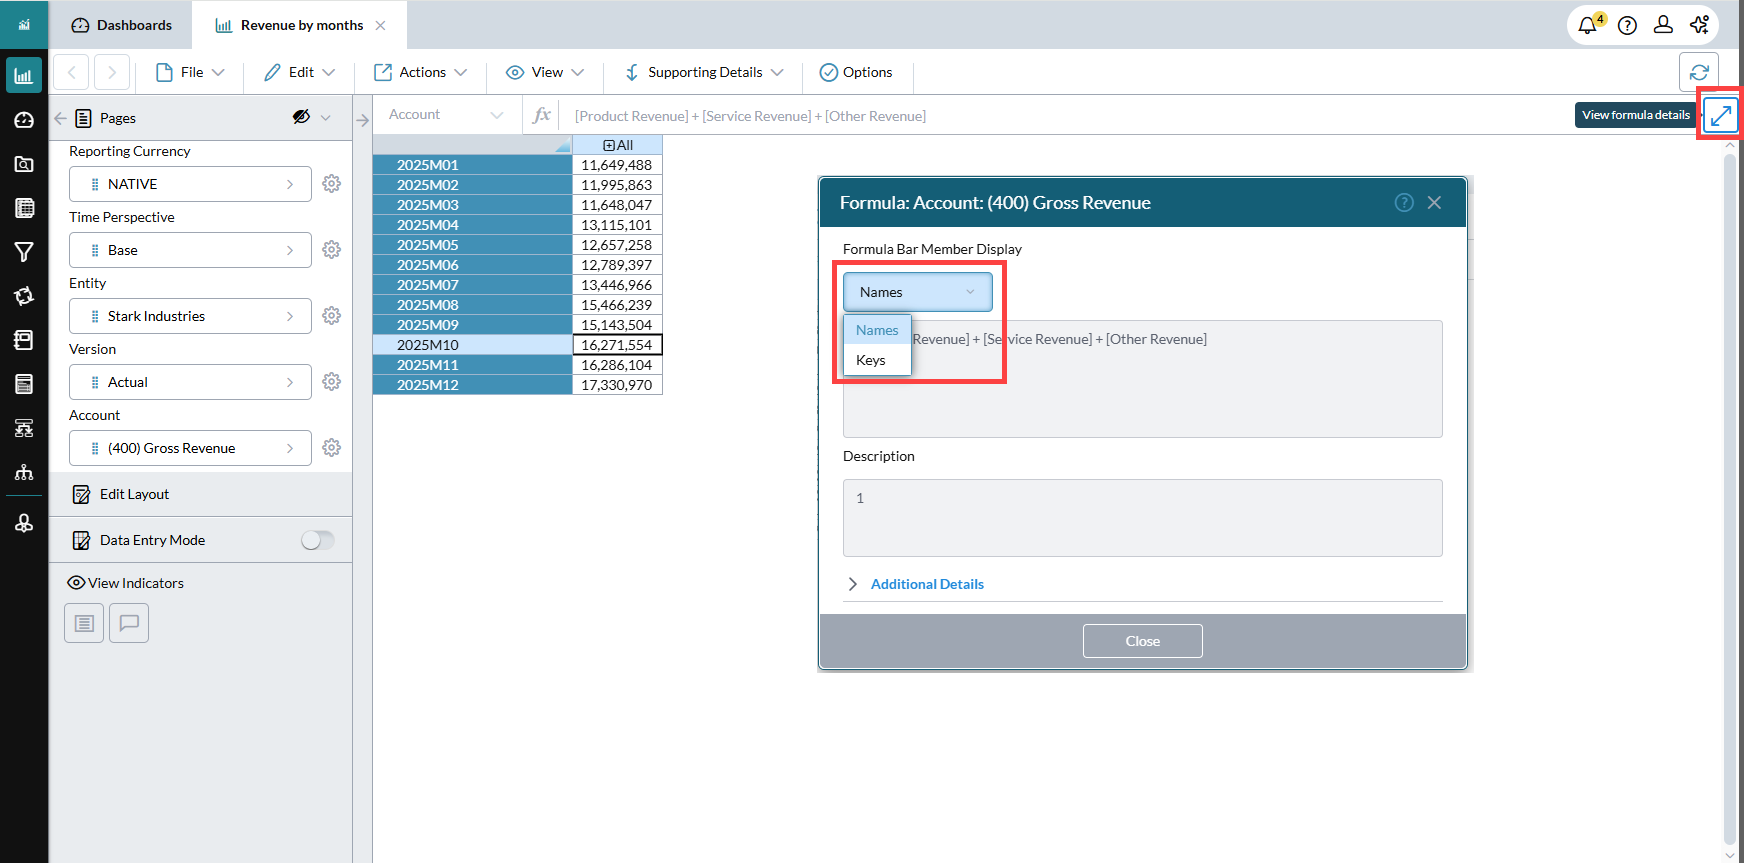
-
Click the View formula details icon to view the formula details. You can also switch between Names and Keys here.
2025.11.3
November 2025
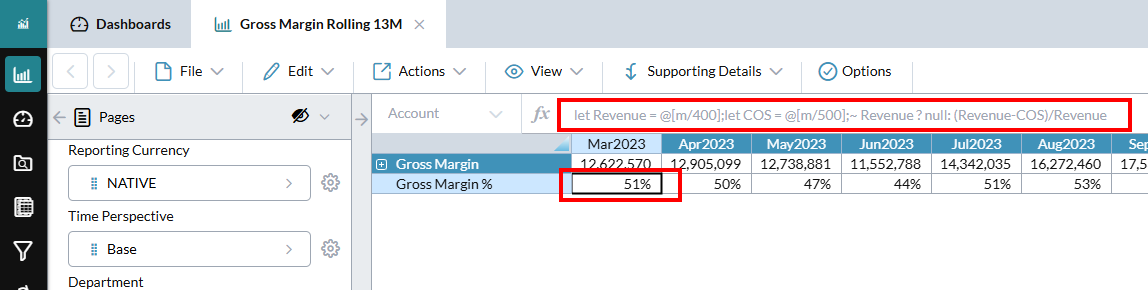
Ad Hoc Analysis: Formula Bar
In Ad Hoc Analysis you can now understand your numbers instantly—no more black boxes.
The new Formula Bar brings Excel-style clarity to your data views. You can see how every value is calculated—directly in the grid—without switching to Model Manager:
Reporting Agent
Getting the columns and rows you want
In Prophix One Copilot, in on-the-fly queries, you can now tell Reporting Agent exactly what you want to see in the columns and rows of the data view (instead of always having Time across the columns).
Some button changes
The Analyze button has been renamed to Reference, and a new Ad-hoc button appears when the Reporting Agent is triggered.
Dashboard Table Tile
The Table tile is a flexible visualization component that brings detailed tabular insights directly into your dashboards. You can now display and explore transactional or summarized data in a spreadsheet-style view—without leaving the dashboard environment.

Further Dashboard user-experience enhancements
Building on the enhancements included in recent releases, Dashboard adds the following:
-
You can now directly share dashboard links with other users, speeding up collaboration.
-
The dashboard background is now a neutral gray color, improving readability and color contrast.
-
Tile borders are now gray, giving tiles a more modern look and providing enough contrast to distinguish tiles without being distracting, ensuring your charts, KPIs, and tables are the primary focus.
-
The default color for tile title bars is now white (instead of red), providing a clean, non-intrusive starting point for dashboards.
-
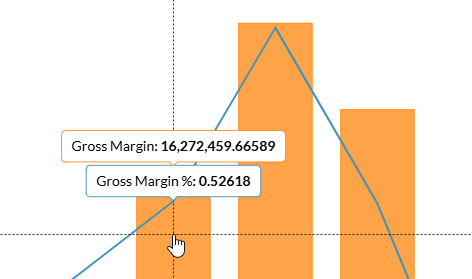
In Chart tiles, the tooltips that appear when you hover have been enhanced to be more consistent and to improve the user experience, as follows:
- Legend tooltips now display consistent with other areas of the application, featuring a blue background and white text.
- Data point tooltips now reflect the color of the corresponding bar in the chart.
-
In design mode, Chart tiles now have a color gradient option:
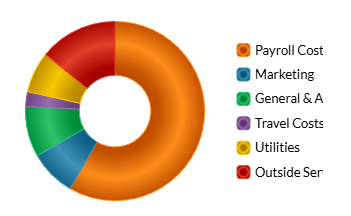
-
In map charts, you now can toggle the map projection between flat and globe:
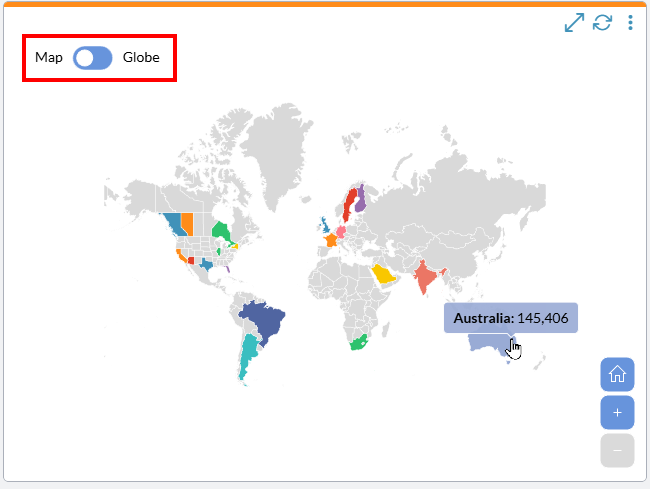
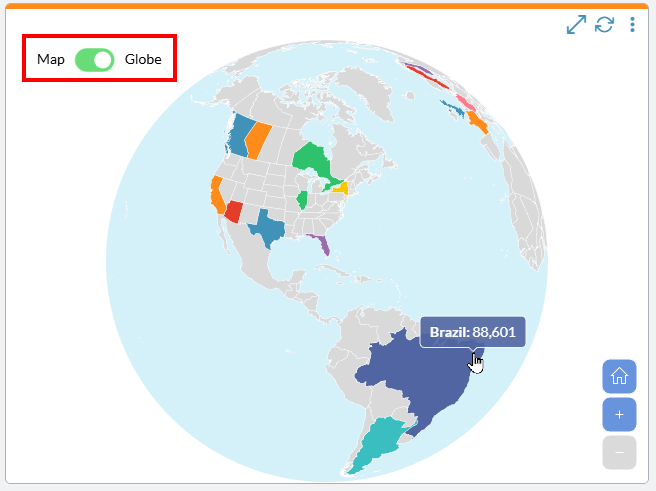
Note that in either mode, you can click-and-drag the map or globe to suit your needs.
Easier product feedback
In the (Help) menu, selecting the Product Feedback option, instead of launching a new browser tab, now opens a dialog, allowing you to provide your comments and ideas without leaving your workflow:

Access the Prophix Trust Center
The (Help) menu now includes an option that opens the Prophix Trust Center in a new browser tab:
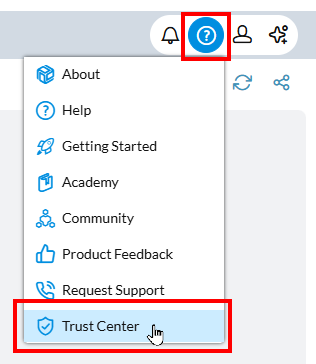
In the Trust Center you can view our security, compliance, and privacy information.
2025.10.0
October 2025
Multi-value Badge tiles
You can now create Badge tiles that display more than one value (thus opening more space on your dashboards for other information):
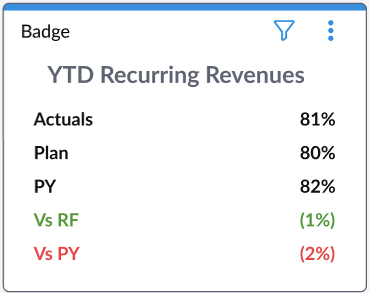
Note: Your existing Badge tiles automatically convert to the new format.
2025.9.2
October 2025
This release contains no enhancements.
2025.9.1
September 2025
Prophix One Copilot
Data Insights is now Reporting Agent
The drop-down listing your AI assistants now includes the Reporting Agent, which is the new name for the Data Insights assistant.
Budgeting Agent
The drop-down listing your AI assistants now includes the Budgeting Agent.
If you are responsible for managing and understanding your team's personnel budget (among many other use cases), you can use this new agent to gain insights into your personnel costs.
Dashboard UX
Additional user-experience enhancements
Building on the enhancements included in the previous release, Dashboard now adds the following:
-
When you hover over an icon tile, a tool-tip now appears.
-
A tile's menu icons are hidden and only appear when the tile has the focus.
-
In all tiles, the Refresh icon has been moved from the "More" menu to the main menu.
New chart types
In Dashboard Chart tiles, two new chart types are available (both are selected from the Other drawer):
-
S-Curve charts
Chart tiles now offer S-Curve (also known as Smoothed-Line) charts:
S-curve charts are useful for depicting cumulative data over time. They are especially effective in scenarios where progress follows a non-linear trajectory—such as project execution, product adoption, or revenue realization. These charts help identify acceleration, deceleration, and inflection points, which are critical for decision-making.
-
Heat Map charts
Chart tiles now offer Heat Map charts:
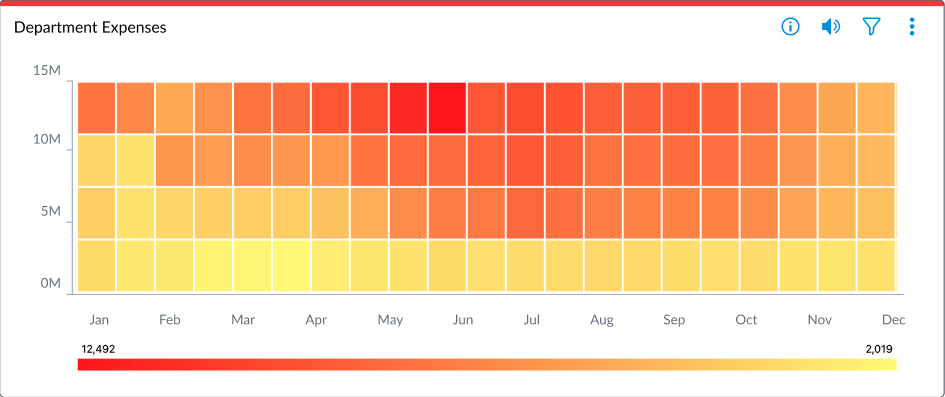
Heat Map charts are useful for visualizing data intensity over time or across dimensions, such as region, department, or product line, and thus support strategic planning, resource allocation, and performance monitoring.
Analyzer integrated with Workflow
Users of Analyzer can now integrate their Excel workbooks into workflows (for example, budgeting), allowing owners, observers, and approvers to receive notifications, track the process, and see how the numbers were arrived at, improving accountability.
In Workflow Manager, you set Task type to Excel Analyzer - Data Entry; the owner of the task is subsequently notified and can add the workbook to the task.
2025.7.1
August 2025
Dashboard UX modernized
A new layer of interactive and dynamic charting and user-experience enhancements make Dashboard more engaging to use while also improving its ability to tell a story. For example, when a dashboard loads or a file opens, all the charts animate smoothly. Other improvements include:
-
Improved hover tooltips and other subtle animations:
- Heat-map charts
-
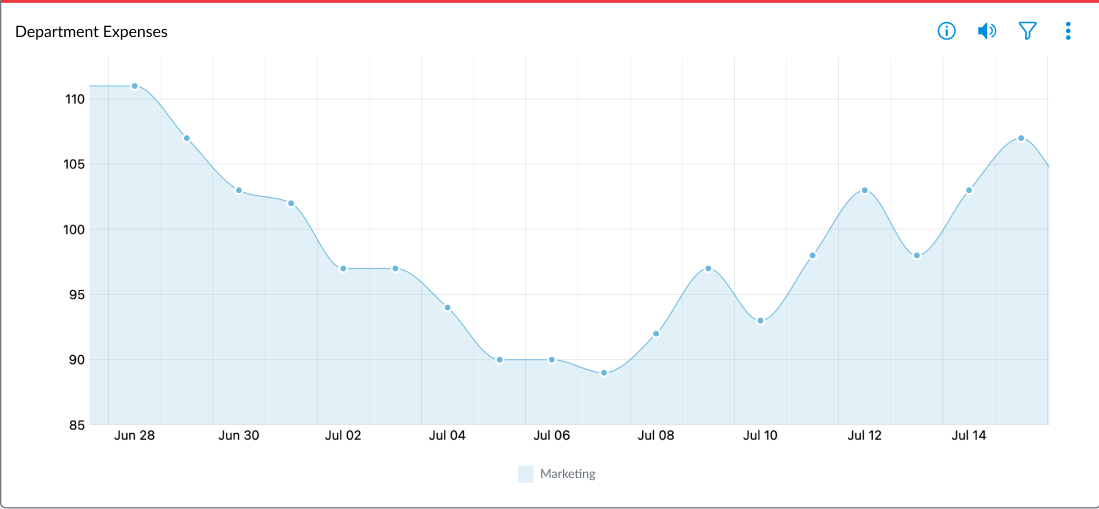
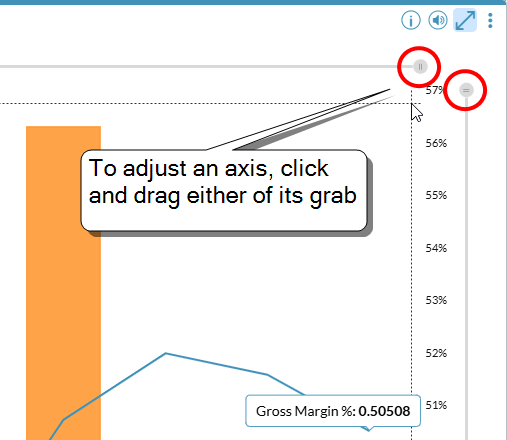
Dynamic axes adjustment as you zoom in or out, making it easier to focus on trends without losing context:
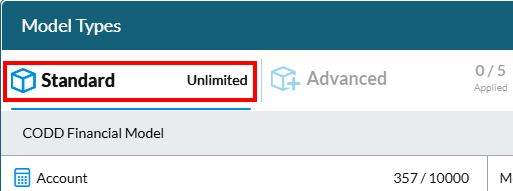
Unlimited Standard models
When your Standard model count limit is 15, in the Model Types dialog the count threshold changes to Unlimited:
2025.6.0
July 2025
This release contains enhancements to Prophix One Copilot. For more information, see the Prophix One Portal's What's New page.
2025.5.0
June 2025
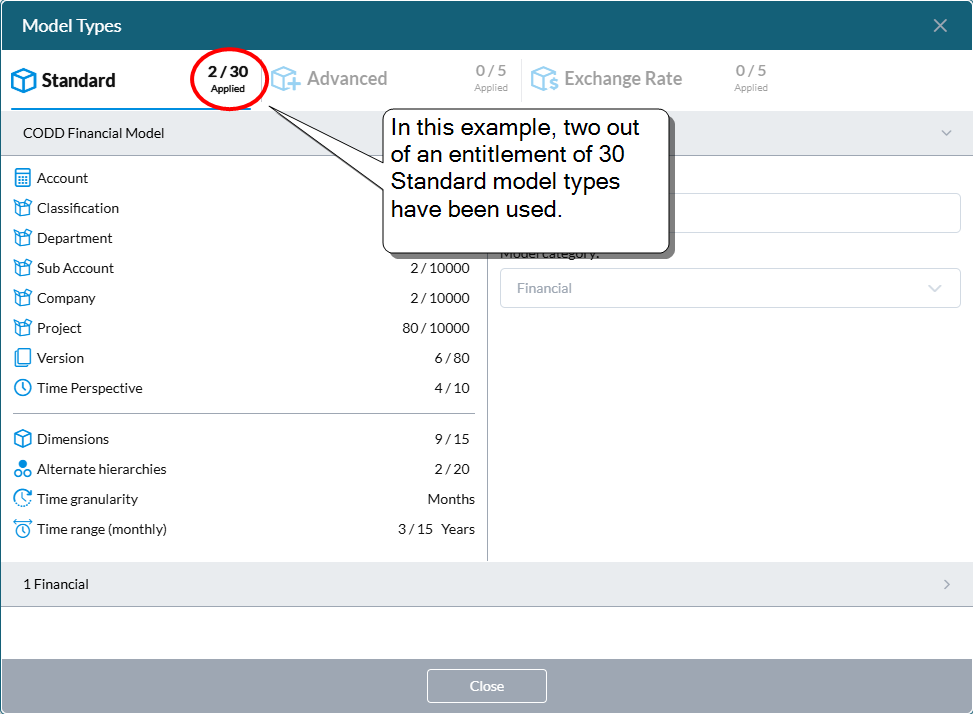
Model types
You can now see a summary of your models and their distribution among model types, as well as the consumption of model types versus the entitlement provisioned:
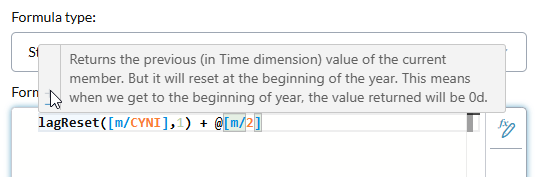
Formula Editor
Now when in Advanced mode and you hover on a function's name, a tool tip appears showing a brief description of the purpose of the function:
To expand the function description, click :
2025.4.0
May 2025
Formula Editor
This release adds several enhancements to the Formula Editor in Model Manager.
Syntax highlighting
Formulas now use color to improve readability and usability:
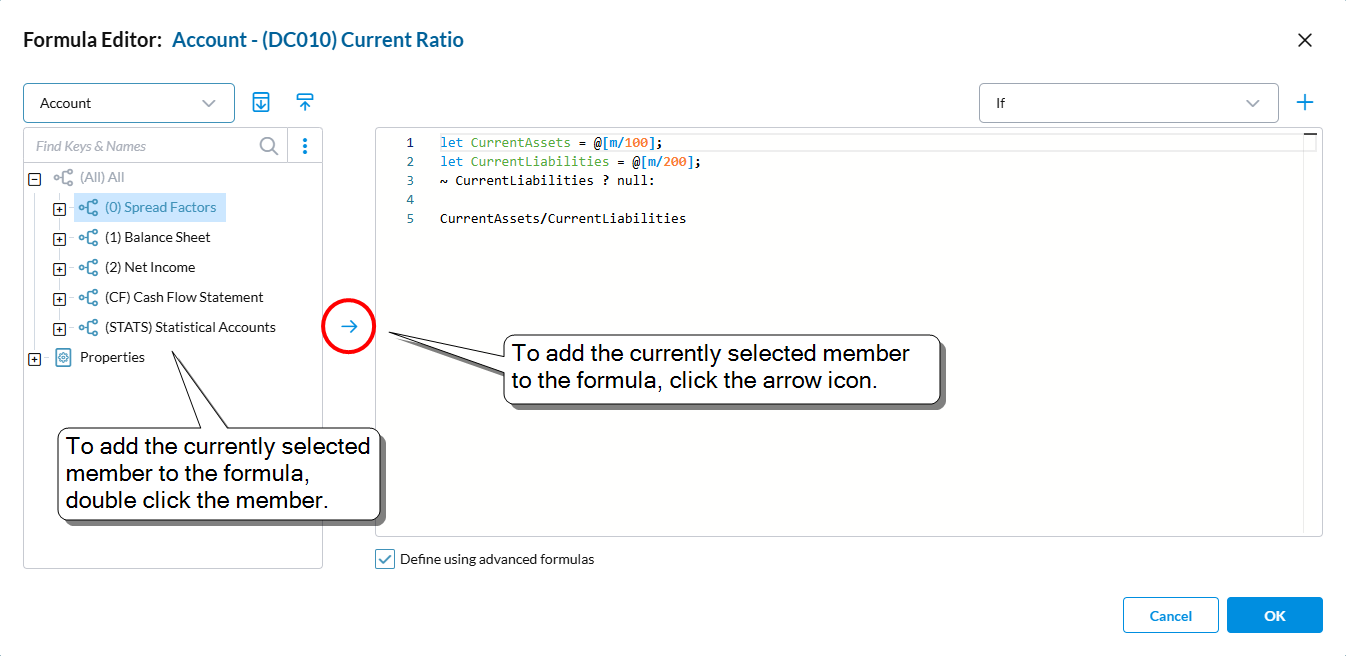
Adding members to formulas
You can now copy members from the hierarchy tree into the formula box (inserted at the current cursor place) in two ways:
-
Double-click the member
-
Select the member and click the right-arrow icon (Add Selection)
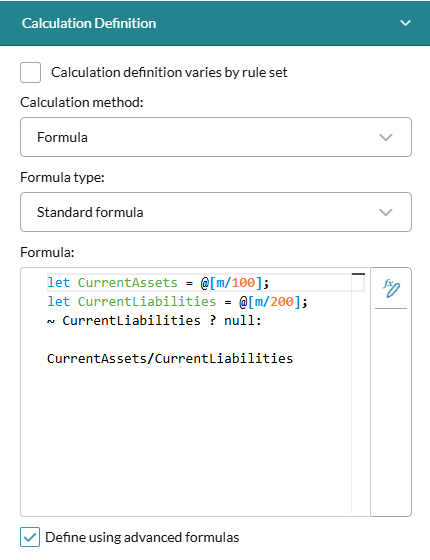
Basic and advanced modes
Formula Editor now provides two modes:
- Basic (the default):
- The editor provides no assistance; you add and complete the functions yourself.
- The formula can use only simple math operators ( + - / * () ).
- The formula cannot reference members belonging to other dimensions.
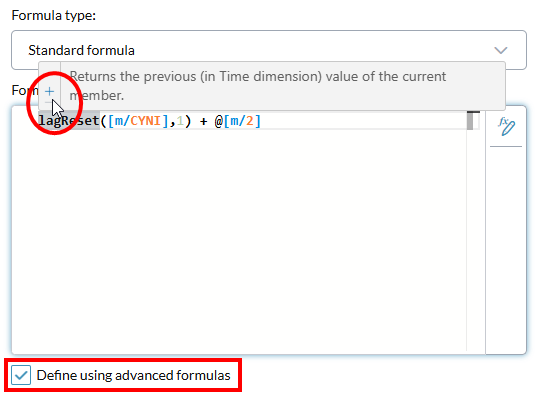
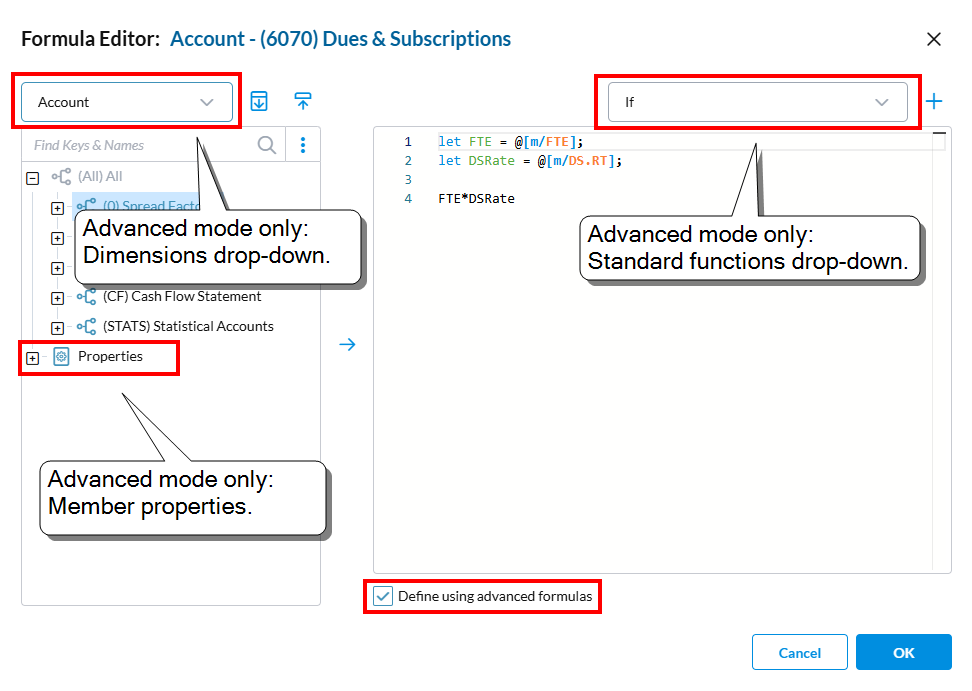
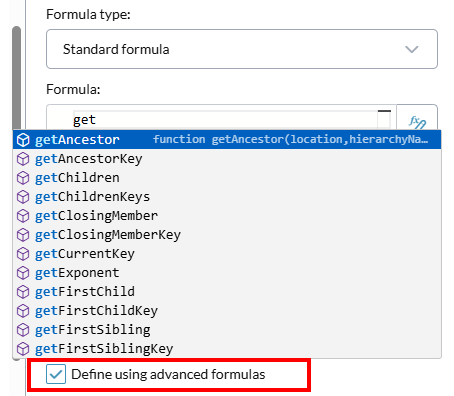
- Advanced: the editor provides enhanced formula editing, and the following additional features appear in Formula Editor:
- The ability to switch to other dimension hierarchies for use with the formula.
- A list of standard functions to select from.
- A member Properties node in the hierarchy
To enter/exit advanced mode, turn on/off Define using advanced formulas:
Enhanced formula editing
When inputting formulas (in advanced mode) the editor now provides formula syntax prompts and auto-completion, for the functions in the Pro Calc Library:
2025.3.0
April 2025
Prophix One Intelligence
-
Task Assistant is now part of Prophix One Intelligence, a set of virtual assistants powered by AI.
Note: Before you can use Prophix One Intelligence, your Portal admin needs to enable the feature, and then each virtual assistant that your organization wants to use.
Filter Manager
Filter Manager includes several enhancements.
Default sort order
- Now by default Filter Manager sorts filters on the Name column.
Double-click to edit a filter
- You can now double-click a filter's row to open the filter in the Edit Filter dialog.
Order by member property
- You can now, in the filter types Complex and Member Property, add custom sort conditions based on member properties.
Reverse-chronological-order option in Time Range filters
-
In a Time Range filter, you now have the option of reversing the chronological order of the results.
InfoFlex process
- Two new processing options have been added, Sequential and Group. The latter excludes missing value combinations and therefore speeds up processing for large volumes of data.
2025.2.0
March 2025
Dashboard
The grid has been enhanced as follows:
- The grid now has ten columns (up from six).
- The grid now better adjusts dynamically to screen size and resolution; on larger screens more tiles show per row, and on smaller screens usability is unaffected.
Data Views and Templates
Now by default Cell Comment and Line Item Schedule indicators are turned off; to see indicators, turn them on and then use the refresh option to cause the indicators to appear.
This enhancement causes data views and templates to load much faster.
Document Explorer
You can now copy the properties of a file to the clipboard for pasting outside the application.
Filters Manager
Supporting notes have been added in Filters Manager, Edit Layout, Member Selector, and the Export Data process describing restrictions in the use of Complex filters.
Journal Manager/Process Manager/System Hub
In Journal Manager, Process Manager, and System Hub, you can now expand/collapse the left-side panel horizontally by clicking the arrow at the top-right corner of the panel.
(This enhancement was previously added to Document Explorer and Model Manager.)
2025.1.0
February 2025
This release contains no enhancements.
2024
2024.3.0
January 2025
This release contains no enhancements.
2024.2.0
November 2024
Prophix One FP&A Plus is new! This is the inaugural release.