Use your dashboard
Your dashboards appear as sub-tabs in the Dashboards tab (your home page):
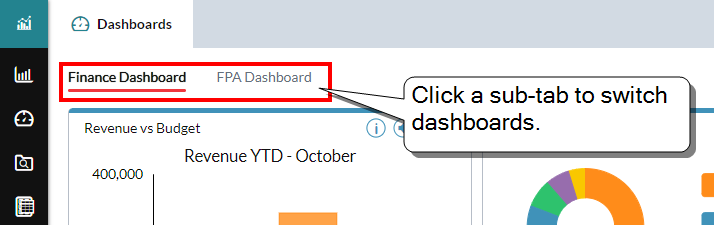
- To switch to a different dashboard, click its sub-tab.
- Your administrator can assign up to five dashboards.
Accessing tile options
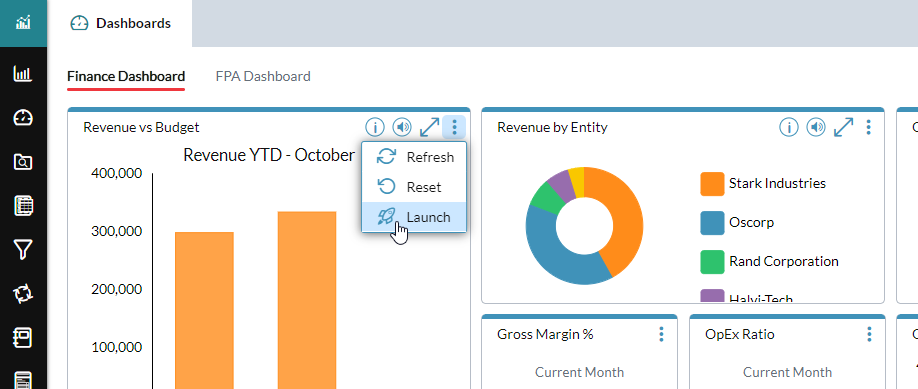
Some dashboard tiles have a set of options in the title bar. To reveal the options, click .
Refresh tile content
- In certain tile types, you can refresh the content by clicking > .
-
To refresh all tiles in a dashboard at once, click at the top-right corner:

Reset the content of a tile
In some tile types, you can return the content to the default settings by clicking > .
Filter the tasks in your Workflow Tasks tile
Click and select the task statuses to show or hide (In Progress, Past Due, and so on).
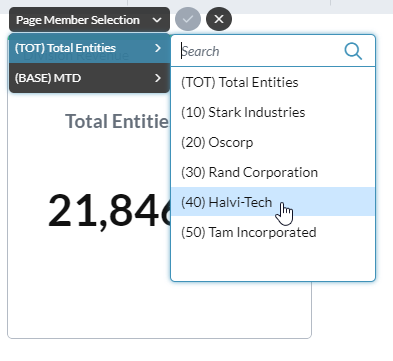
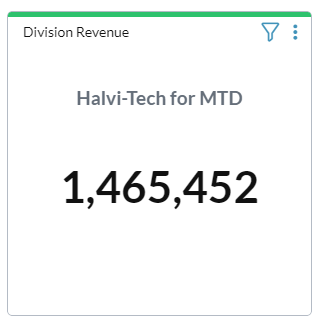
Change a badge tile's member combination
You can change the member combination displayed in a badge tile.
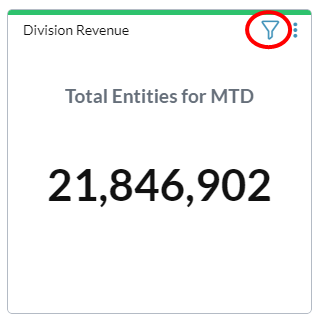
If a badge tile has a icon, clicking it reveals a menu of page dimensions. Selecting a page dimension and then a member changes the value displayed in the badge:
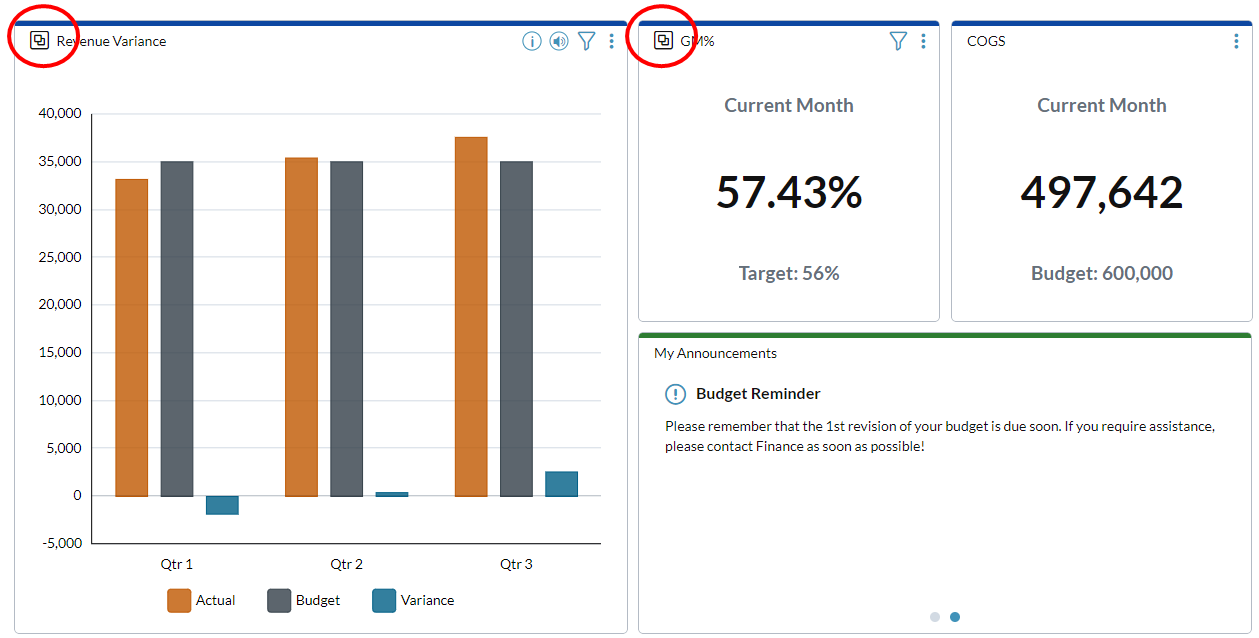
Change a tile group's member combination
You can change the member combination displayed in a tile group.
A dashboard can have a tile group, which is two or more tiles that derive their data from the same model and that the designer has set to use the same page dimensions as filters. Tiles that belong to the group are indicated with a icon in the top-left corner:
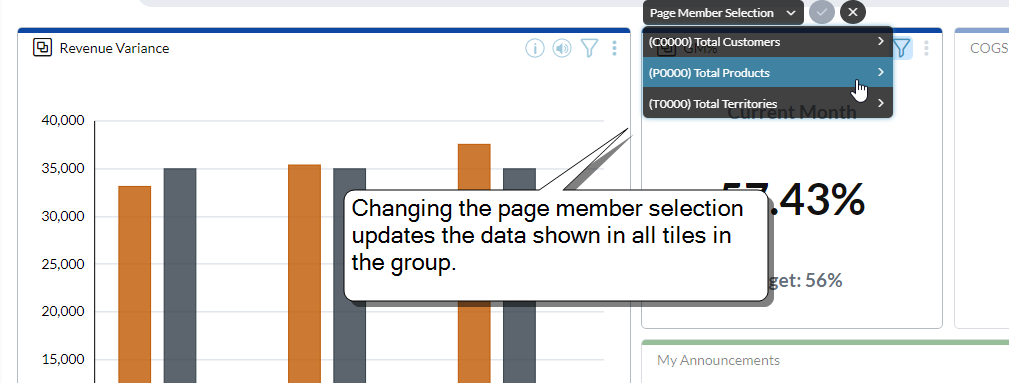
When you click and change the page selection in one group member, the data displayed in all the group's tiles changes to the new page dimension:
Open a new tab
Most dashboard tiles provide an option to show additional information. Clicking > has the following result:
- Favorites – opens a Document Explorer tab, showing your Favorites section
- Workflow Tasks – opens your Workflow Tasks tab
- Chart – opens an Ad Hoc Analysis tab, showing the source data view relative to the data level selected in the chart through drill up/down; if you made a page selection, or a members selection in rows and columns, this is reflected as well
- Badge – if the badge uses a data view for its data source, opens an Ad Hoc Analysis tab, showing the data view; if you made a page selection, this is reflected as well,
- iFrame – opens a browser tab, showing the linked web page
Dashboard charts
Charts are highly interactive. You can click or right-click many of the elements to change the display of the data or the appearance of the chart.
Enlarge a chart
- To open a larger version of a chart for better viewing, click .
-
To close the chart, click again.
Drill up or drill down
-
Right-click a data element, a category label, or a series in the legend, and select , .
Note: Drilling is not available if a chart's data view has multiple hierarchies (for example, if rows or columns in the data view use two or more dimensions).
Drill across
-
Right-click a data element and select .
Note: If multiple drill-across definitions are defined for the model, a dialog opens and you select the definition to use.
Hide a series of a trendline
- In the legend, right-click the item and select ; the corresponding data elements disappear from the chart.
- To restore them, repeat the action.
See a data point value
- In certain chart types, hovering over a bar, column, or line reveals the name of the series and the value of the data point.
Refresh chart data
-
Click > .
Tip: The Refresh option always applies to the current data view, so you can use Refresh even if you have drilled-down.
Reset the chart
- Click > .
Open the source data view
- Click > . The data view opens in Ad Hoc Analysis.
Open the linked template
If the chart has a linked template, you can open the template in Template Report Mode, on the data related to that element.
- Right-click a data element and select .
Change the member display mode of the category, series, or legend labels
The member display mode (Names, Keys, Keys & Names, and so on) derives from the source data view.
- In Ad Hoc Analysis, open the data view and make the changes.
Change the member combination displayed in a chart tile
If a chart tile has a icon, you can change the member combination the chart shows.
-
Click :
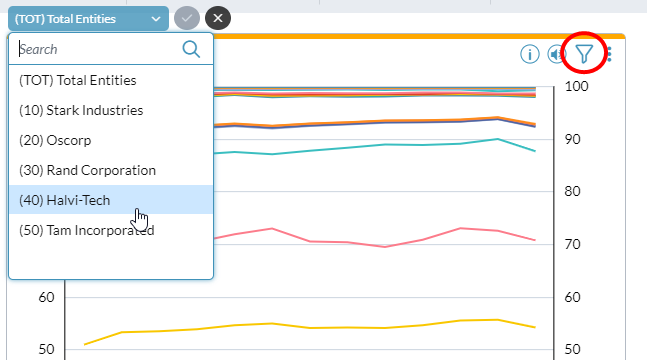
- Select a page dimension and then a member.
Tip: To return the chart to its default data setting, click > .
Use Chart Insights
- Chart Insights is an Opt-In feature.
Dashboard FAQ
What is a dashboard?
The page that you see when you sign in is your dashboard. It functions as your home page.
Who creates dashboards?
Admins create them using Dashboard Studio.
Note: Your admin can give a tile a custom name, so you may see tile names that differ from the ones described here.