Chart Insights
Read or listen to a chart insight. Click or . (If you don't see these icons in a chart tile, then the chart doesn't qualify for a chart insight.)
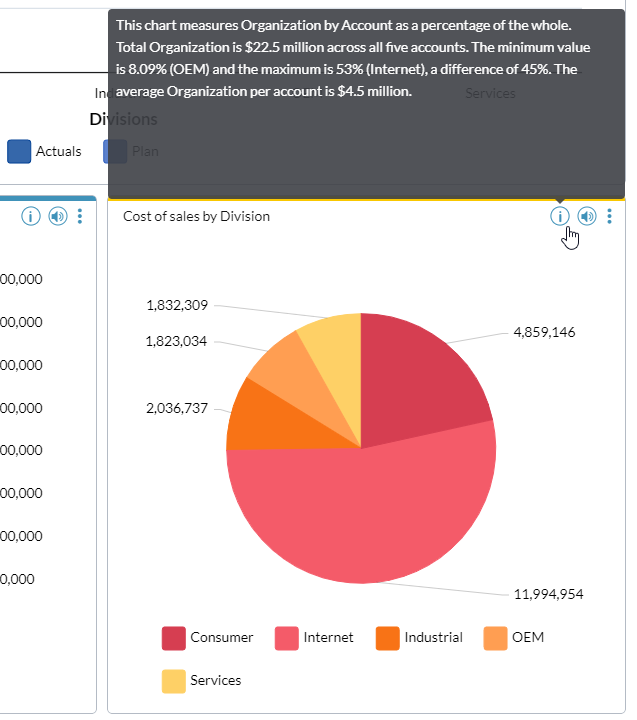
Chart Insights FAQ
What is a chart insight?
A chart insight is an attribute found in some (not all) chart types and gives a brief description of a chart's purpose, along with a summary of its data. The dashboard user can open the chart insight to read and/or listen to it.
How is a chart insight created?
A chart insight is automatically generated for all charts that qualify.
What chart types qualify for chart insights?
All chart types are candidates for chart insights, except the following: gauge, funnel, and bullet charts.
How does a chart qualify for a chart insight?
To have a chart insight, the structure of the chart's underlying data view must meet the following criteria:
- The columns axis contains only one dimension, with two or more of its members.
- (For any dimension other than Time, the column axis members must not exceed 10.)
- The rows axis contains only one dimension, with two or more of its members.
- The Time dimension can be on either axis, but its members must all belong to the same level in the dimension.
- The number of series (that is rows) must not exceed the series limit for chart tiles. (The series limit is 26).
- For a pie chart, the number of slices must not exceed seven.
- Every cell in the data view must be viewable under the data access permissions of the user of the dashboard.