Add ISO codes for map charts
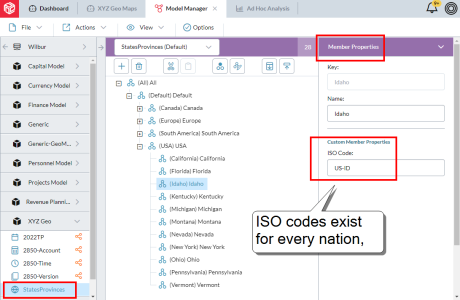
ISO codes allow you to connect model data to map charts.
This page describes how to add the codes and then use them in map charts.
In the current release, map charts recognize the following ISO country codes:
- All single country codes
- USA state codes
- Canadian provincial codes
1. Add the ISO codes
ISO codes can be stored as follows:
- In a new Geography dimension's Key or Name member.
- In any existing dimension's custom member property.
- The data type is Text.
- The length should be at least 5.
The differences are a follows:
- With your ISO codes in Key or Name, if your Default hierarchy has children, you will be able to drill up or down.
- With your ISO codes in a custom member property, they will be in an Alternate hierarchy, which precludes drilling.
- With your ISO codes in a custom member property in a non-Geography dimension, in the data view layout you will need to place the custom member property inside Rows.
Note: All steps and examples on this page use the custom member property approach to implementing ISO codes, as it is the most common use case.
To add ISO codes
- In Model Manager, select the model's Organization (Geography) dimension.
-
In the lip, click .
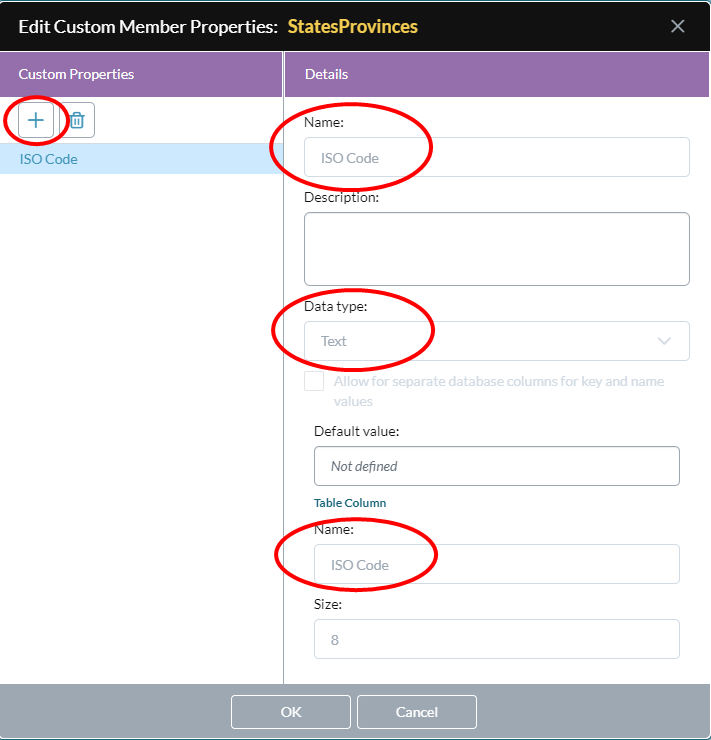
The Edit Custom Member Properties dialog opens.
-
Click and complete the details similar to the following example:

- Click OK and save your changes.
-
Add ISO codes to the new custom member property of any member of the dimension that you want to include in map charts.
The following is an example of a Geography dimension with ISO codes:
- Publish the model.

2. Lay out the data view
You use a data view to define what country, state, or province data appears in the map.
The data view layout also determines the area that the chart displays: the map can be for either the entire world or a single country.
Note: To see the map the user requires data viewing privileges for the model.
If the dimension members are in the Default hierarchy (but not an Alternate hierarchy) the user can drill down in the map.
To lay out the data view for a map chart
- In Ad Hoc Analysis, open Edit Layout.
-
In Choose Layout, add the Geography dimension that contains your ISO codes to Rows.
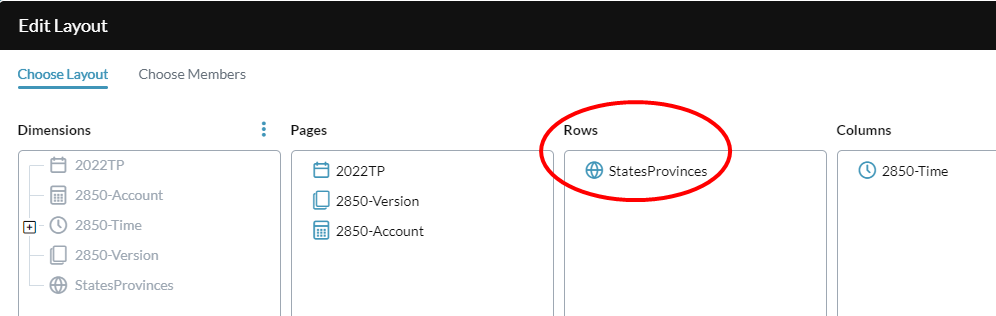
Note: For use with map charts, Rows must contain only the ISO codes dimension; adding a second dimension means the map chart will not work.
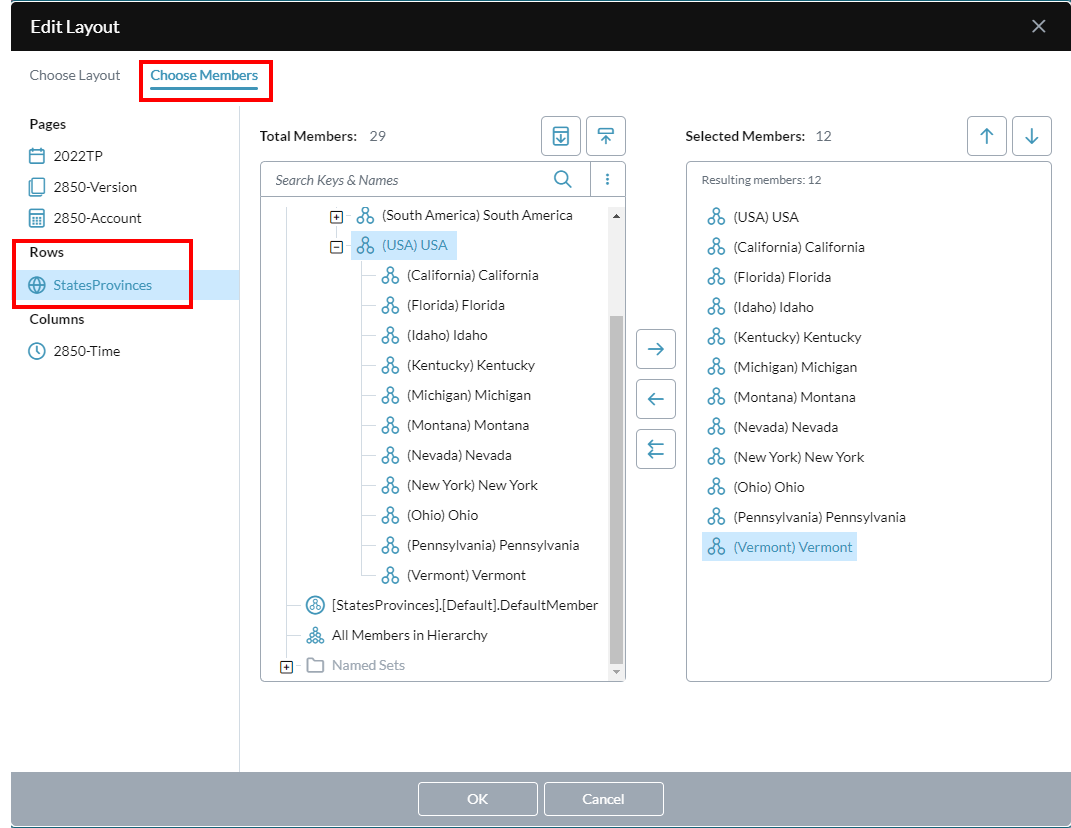
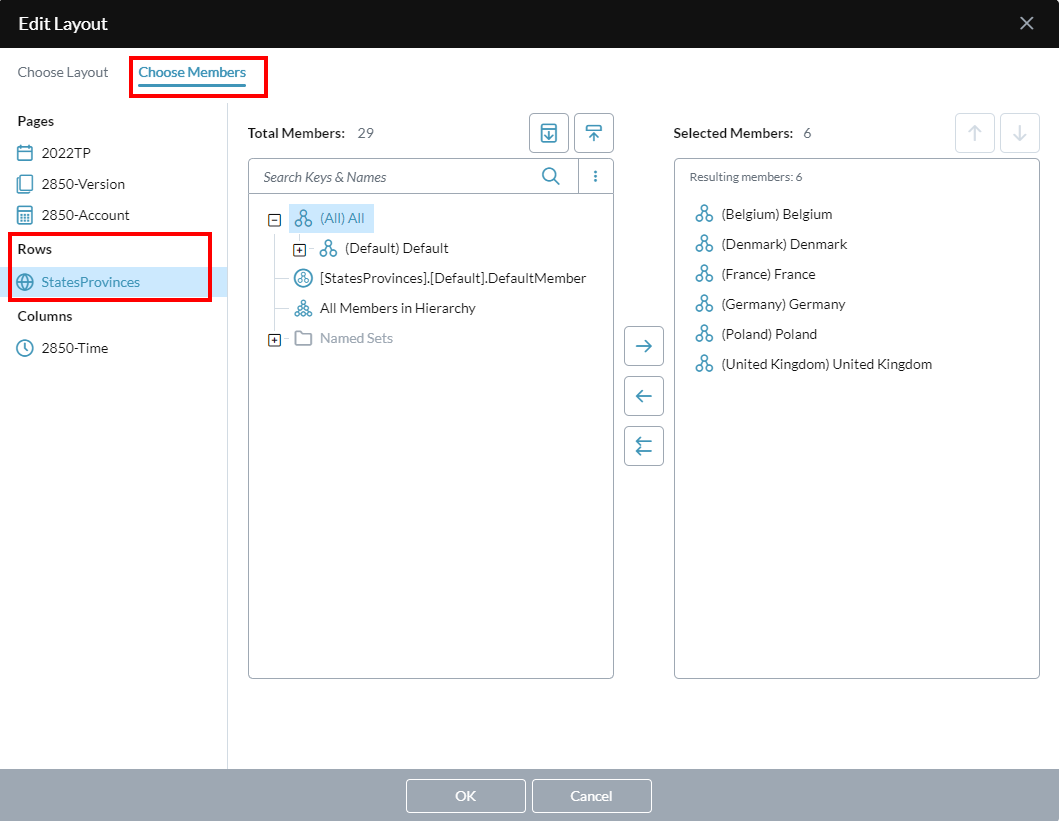
-
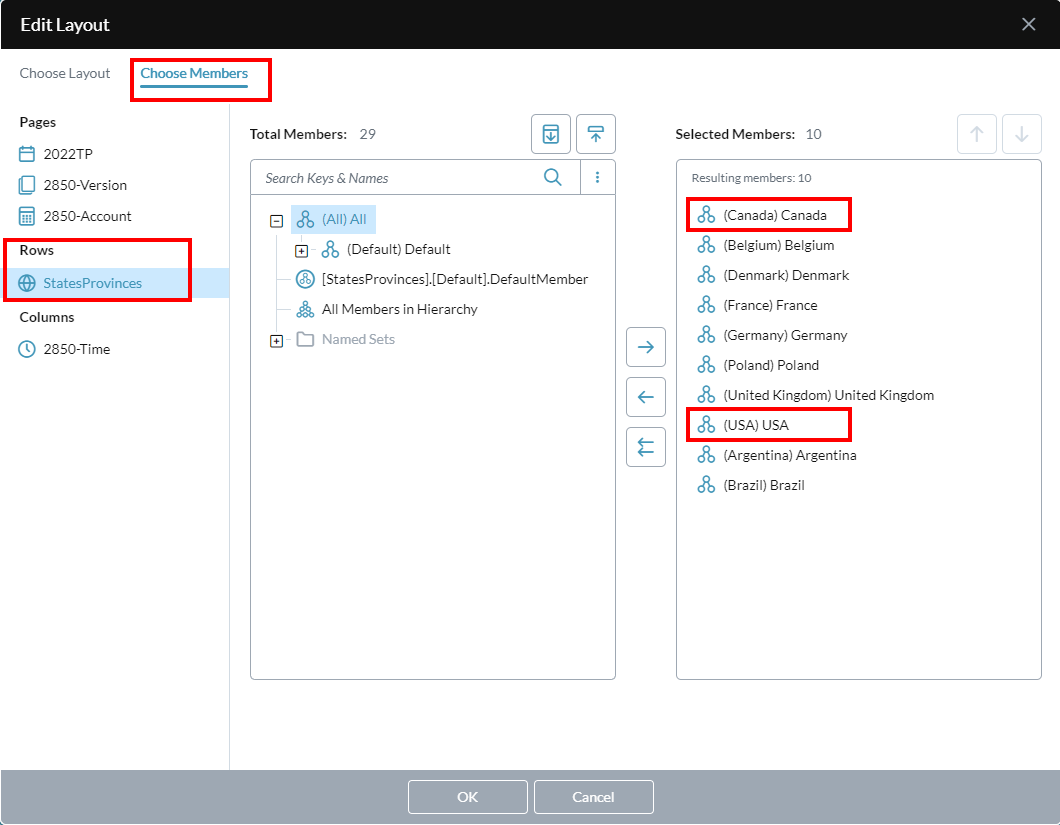
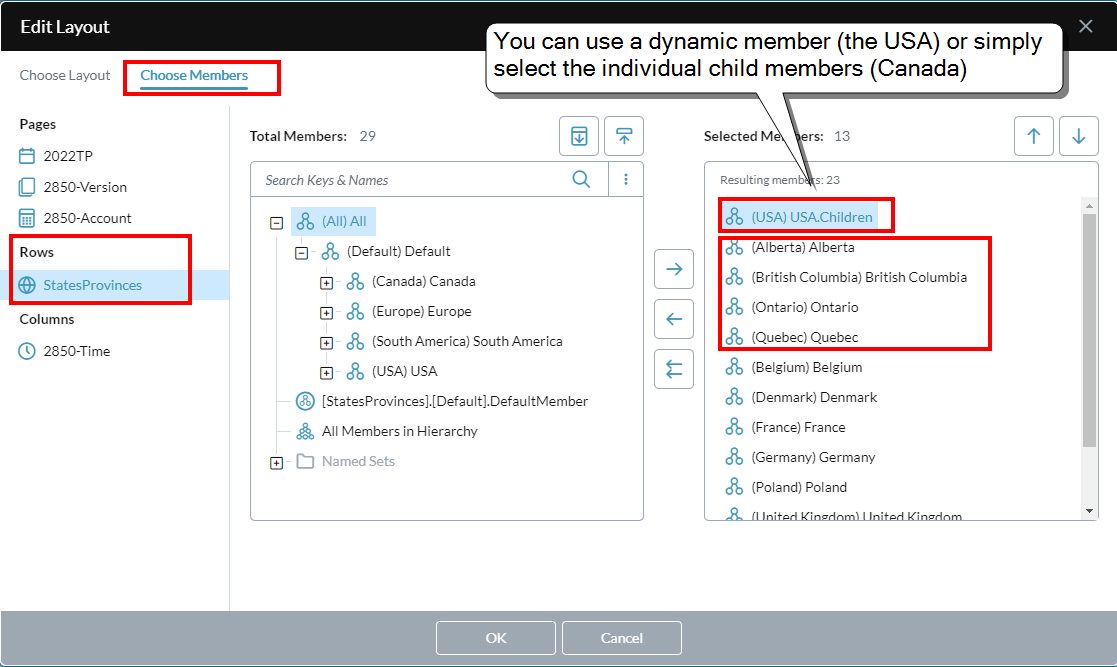
In Choose Members, select the members of the Geography dimension that you want to appear in the map chart:
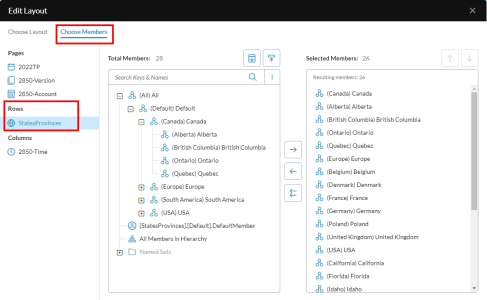
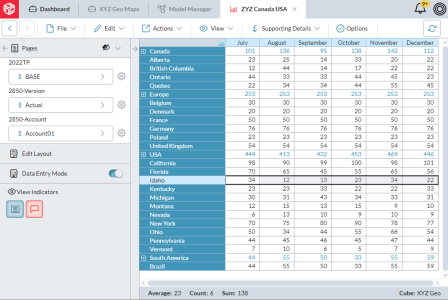
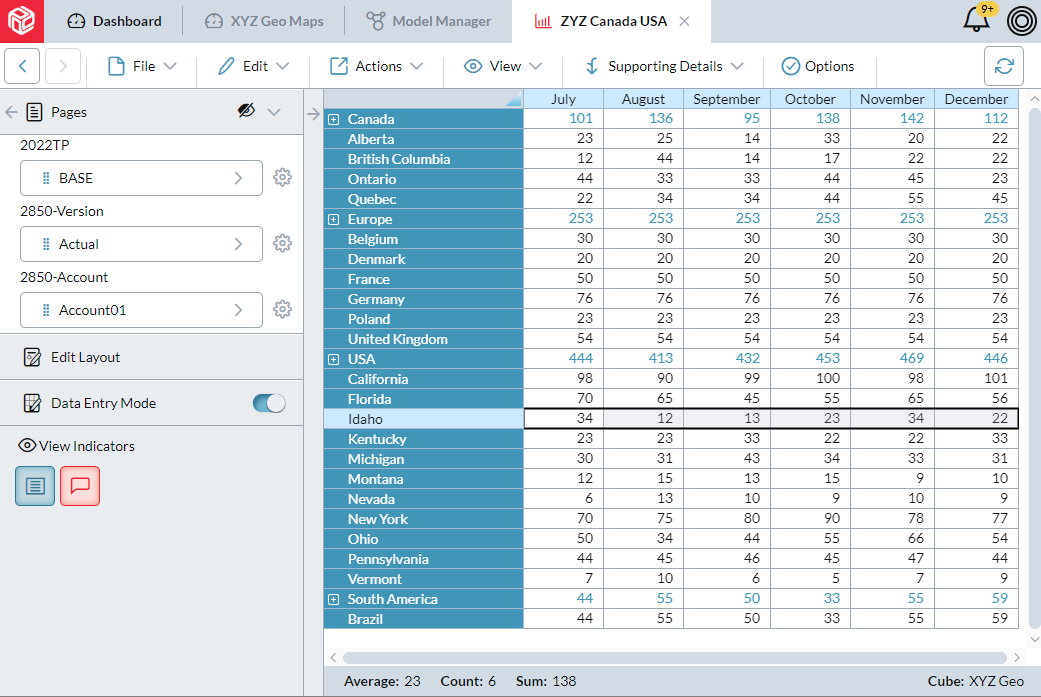
Your data view will look similar to the following example:
- Save the data view.

3. Link data view to map
The final step is to link the data view to the map chart and specify where the ISO codes are stored.
- In Dashboard Studio, add a chart tile.
- Open the tile's Properties dialog.
- From Data view, select the data view you created in previous procedure.
- Open the Map drawer and select a map chart type.
-
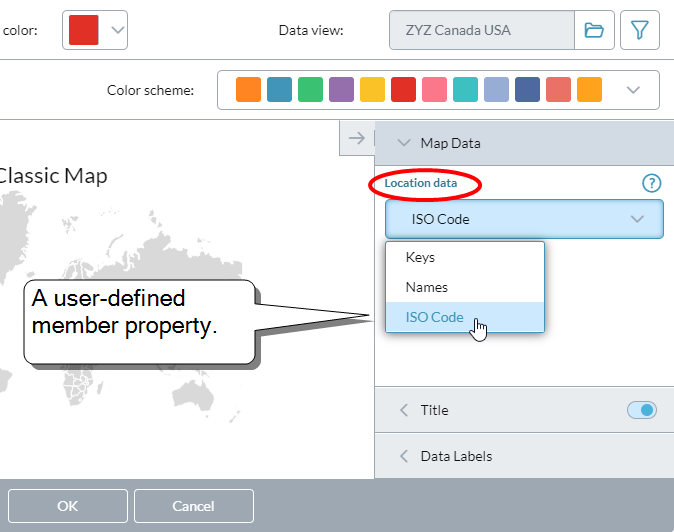
Open the Map Data drawer:

-
From Location select the member property that contains the ISO codes.
The map immediately colors all nations that have an ISO code defined in the member property.
- Click OK.
Example map charts
The examples below show how to set up different kinds of maps.
All the data views and maps use the same model and Geographic dimension described above.
To get a different kind of map, all you need to do is:
- Open the linked data view in Ad Hoc Analysis.
- Open Layout Editor and change the member selection for the Geography dimension.
All the examples below show:
- The member selection for the Geography dimension
- The resulting map in the linked map chart
US states only
This example shows how to create a map of only the continental USA—no zoom-and-drag is required.
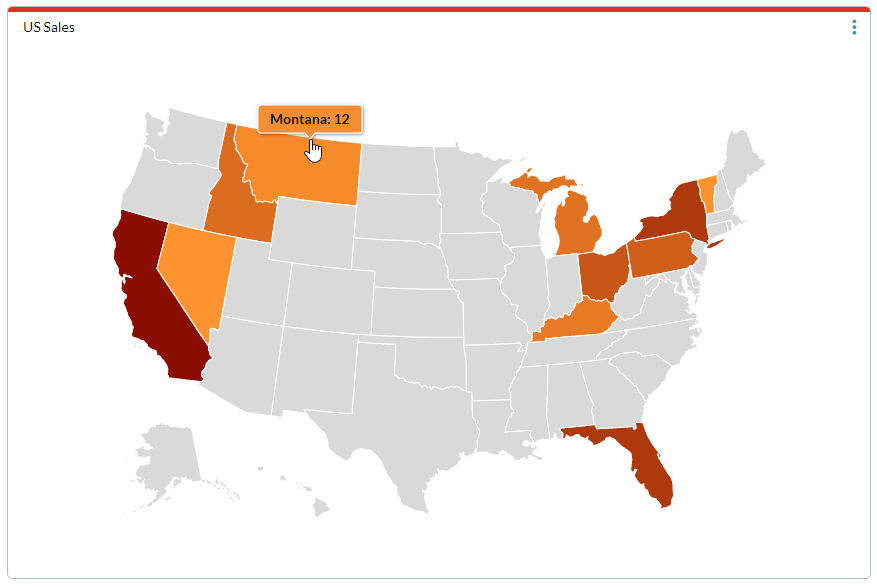
By selecting the members individually rather than using dynamic members, you can include or exclude states as needed.
Canadian provinces only
This example shows how to create a map of only Canada and its provinces—no zoom-and-drag is required.

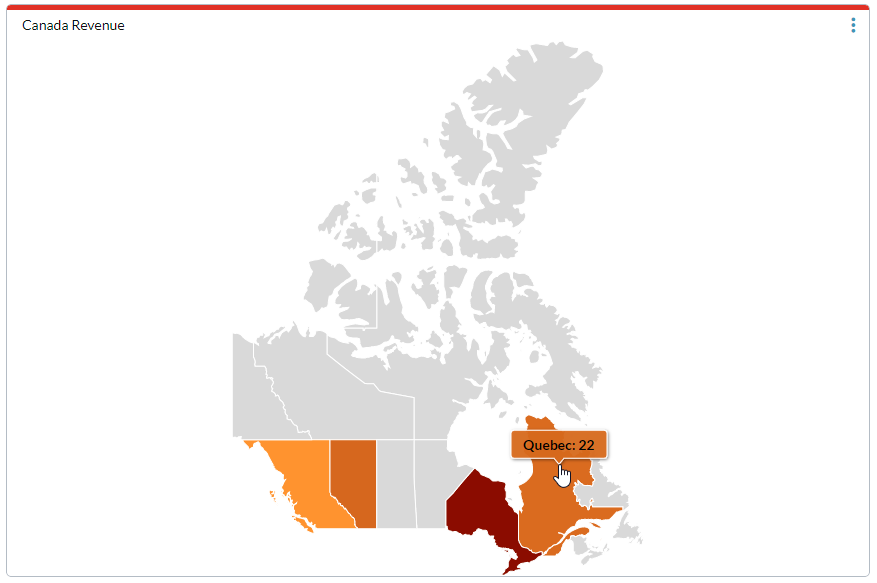
Note that this example uses a dynamic member.
Map of European countries only
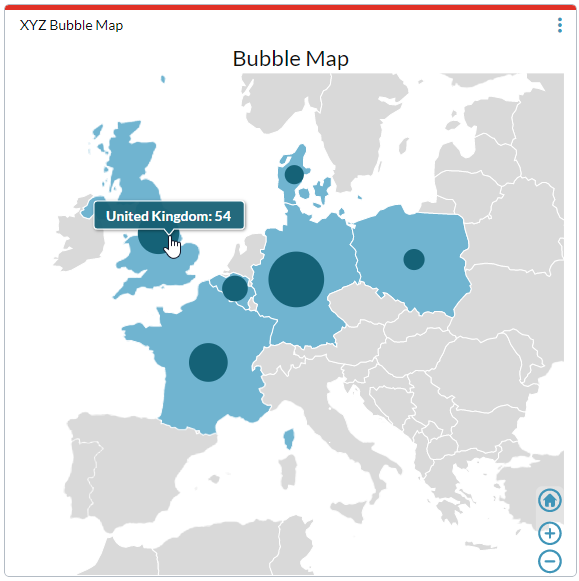
Note: To get the view shown, the user will need to zoom and then drag.
The Entire world
Note: To get the view shown, the user will need to zoom and then drag.
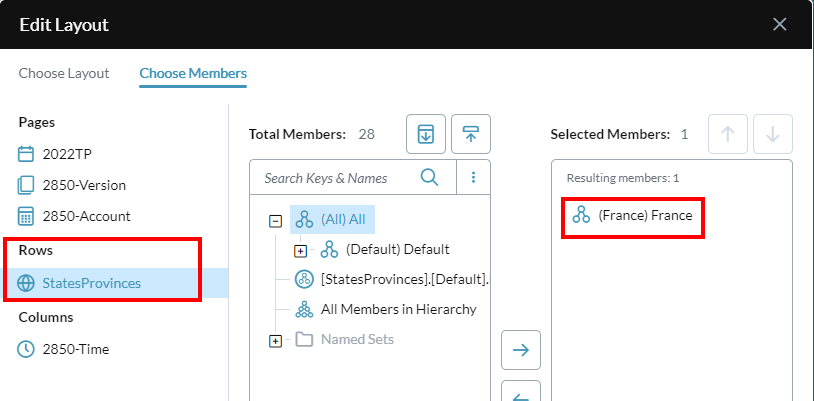
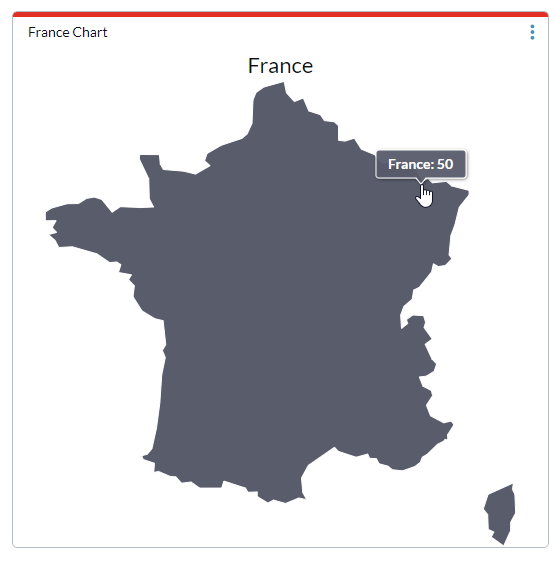
A single country
This example shows how you can display a map for a single country. When the chart runs, the only thing that appears is the country.
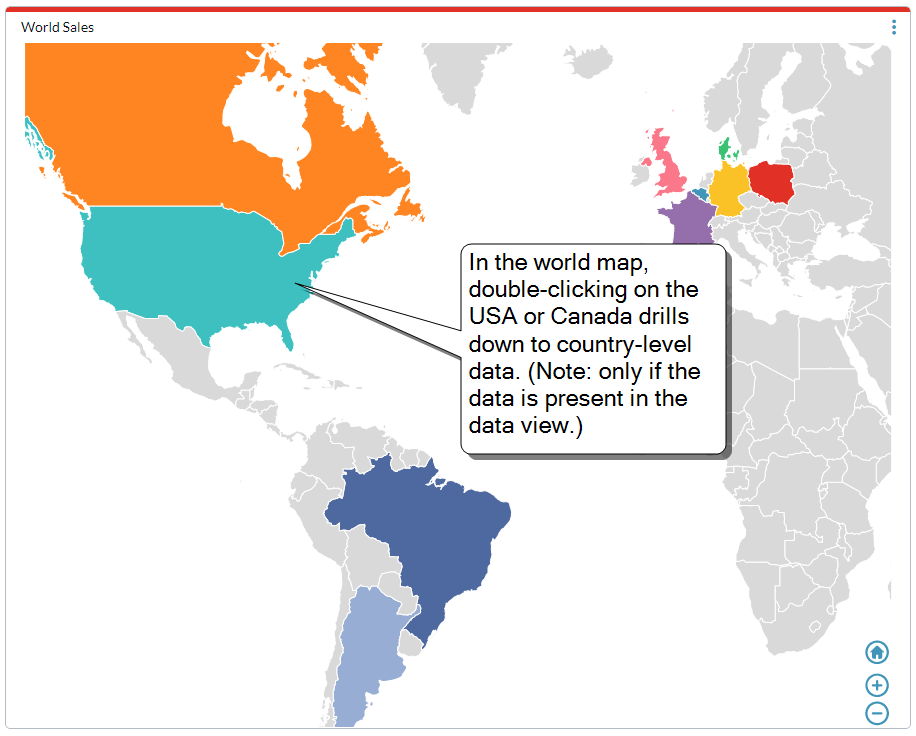
Drilling down
If the data view layout puts the USA and/or Canada at the same level as other countries, but includes state and/or provincial members beneath them, you can drill down in the map chart (the map switches from the world map to the respective national map).
To drill down to the national level, do one of the following:
- Double-click on the USA or Canada.
-
Right-click a region and click


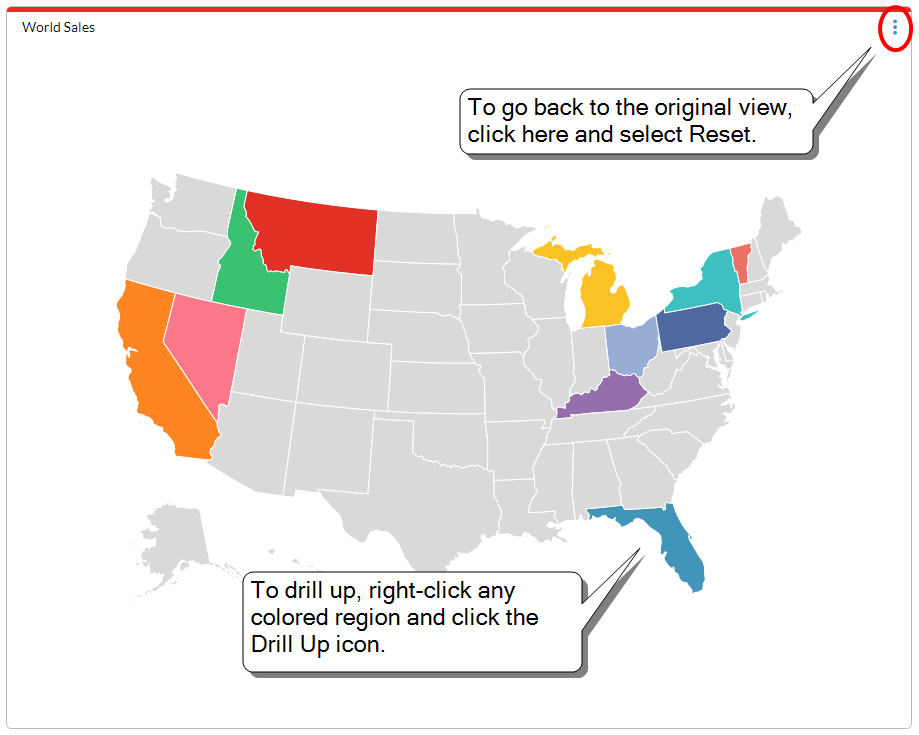
To drill up from the national to the world level, do one of the following:
- Right-click a colored region and click .
- In the top-right select and click Reset.
Solid vs Broken
You can choose to show the USA and Canada, on a world map, as either a single region or as States/Provinces.
The difference lies in the data view layout.
-
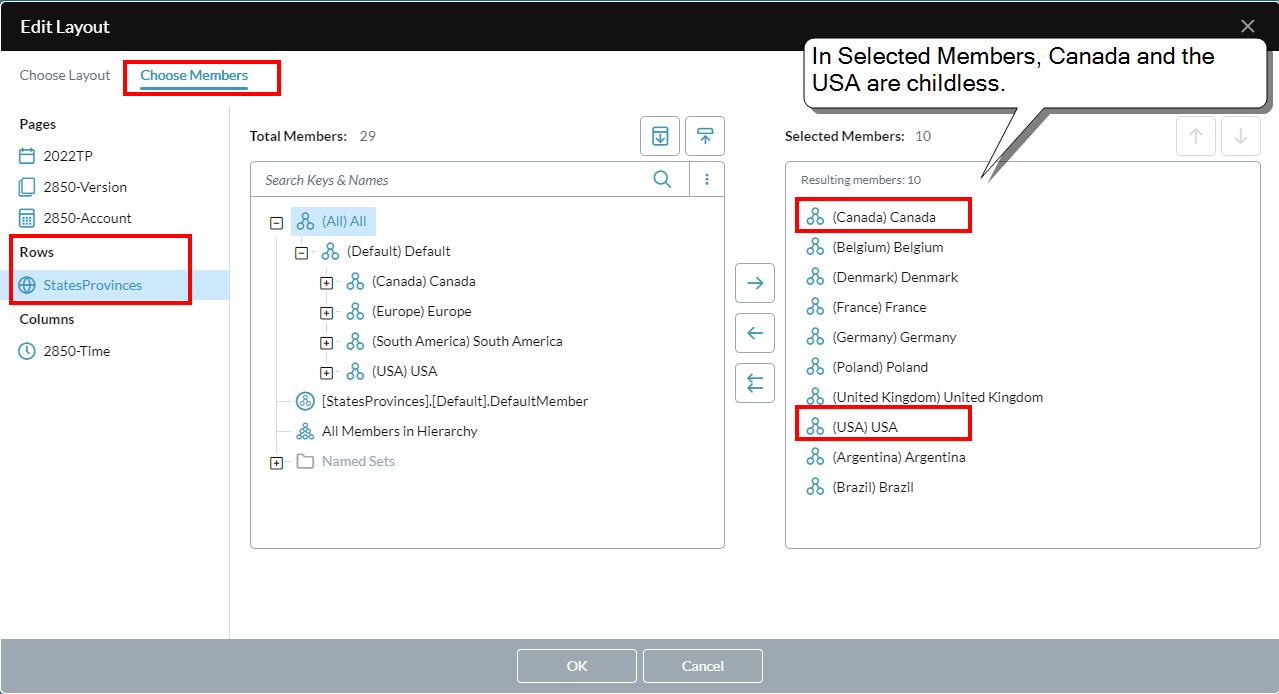
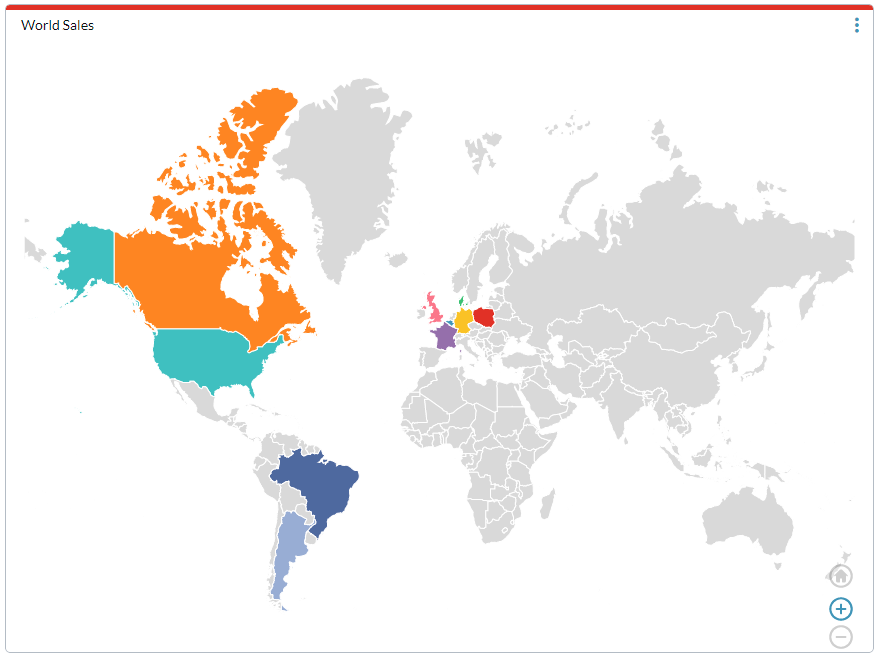
In the following example the USA and Canada's selected members have no children, and on the world map appear solid:


-
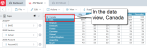
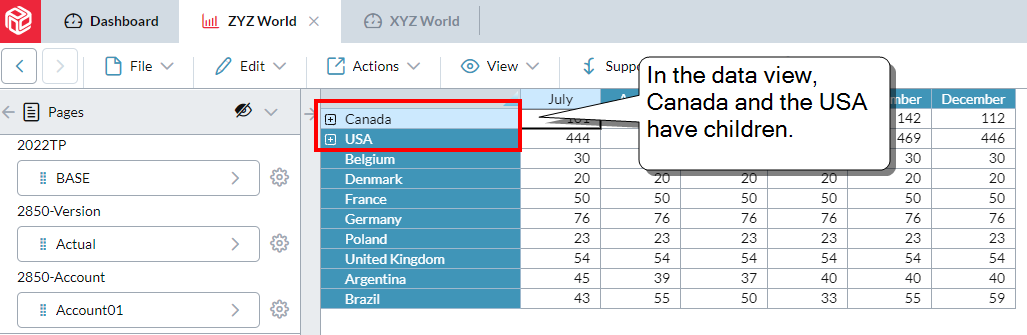
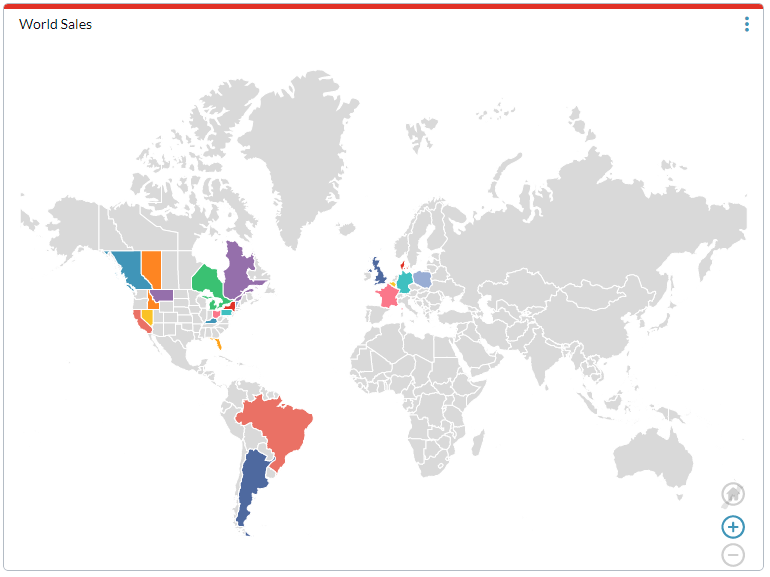
In the following example the USA and Canada's selected members have children, and on the world map appear with their sub-regions:


What you can do in map charts
The following chart tile features are also available in map charts:
- Drilling down on USA and Canada data
- Launching the underlying data view in Ad Hoc Analysis
- Drilling across
- Linking templates